Risk Assessment of Dollar-Cost-Averaging Method in Bitcoin vs USD Pair as Regular Investment using Monte Carlo Simulation

Disclaimer: This article is not an investment advice. This article is intended to be an education purpose only. There is no guarantee that you would make any profit and suffer loss using the stipulated method in this article. This article would only utilize quantitative and technical perspectives in conducting the analysis. Any fundamental parameters and any technology updates such as hard and soft forks on the intended coin are assumed to be neglected. Cryptocurrencies have such a high volatility during the market session, as well as pump-and-dump (PAD) scheme might be occurred in several pairs, thus only trade/invest the money that you could afford to lose.
Introduction to Dollar-Cost-Averaging (DCA) Method
DCA method is a method to buy an investment regularly with the same amount (fixed) of buying at certain time scale, regardless of the investment price. This method is useful for long term investor who doesn’t have much time to do an analysis of lot sizing. However, this doesn’t guarantee that an investor would not lose money on his investment. This method allows investor to buy an investment much more when the price of his investment goes down, once the price is going up, he gains the profit if only the current price is higher than average price of his lump sum investment.
Let us say that John is an investor. He decides to use DCA method and invest $50 in “XYZ” coin on every month. The price of “XYZ” coin at that time is $0.5/XYZ, so John receives 100 XYZ coins. Next month, the price of “XYZ” coin declines to $0.25/XYZ. According to the rule of DCA Method, John should buy the “XYZ” coin on this month. So, he invests the same amount as a month before which is $50 and receives 200 XYZ coins. Thus, he has 300 XYZ coins worth $100 as the total asset.
According to his portfolio, John investment has average price at $0.33/XYZ. Thus, we could conclude that if the price of “XYZ” coin is bullish so that the price could go above his average price, then his investment is profit. But, if the price is bearish and lower than his average price, his investment suffers a loss. Luckily, in the next month, the price of “XYZ” coin is mooning counted at $1.00/XYZ. Then, John decides to sell all of his investment and he receives $300 as he sells all of XYZ coins that he has.
That is just a simple case of DCA method in terms of investing. In practice, there are so many factors affecting the profitability of this method. The major factor is price of investment itself indeed. Cryptocurrency is such a new born investment, so that high volatility of price still exists during its market sessions. Thus, in this article, we would like to do a risk assessment of the intended method in order to obtain an information on how profitable if we invest in Bitcoin . This assessment would involve quantitative parameters only such as probability and historical price data, while the fundamental parameters and corresponding news as well as technology updates would be neglected.
Objectives of Risk Assessment
- To obtain an information on how big is the risk that we would face in the near future in perspective of long term investment.
- To obtain an information on how profitable certain asset in the near future in perspective of long term investment.
Monte Carlo Method
In this article, we would like to perform analysis using Monte Carlo Method . We utilize this method for building the simulation, due to the asset price movement is assumed follows Geometric Brownian Motion and Efficient Market Hypothesis (EMH) thus the price could change vary over the time. Basically, the main idea of building this simulation is we try to simulate the price movement randomly based on Probability Density Function (PDF) which is generated using historical data of daily price change.
Building the Simulation
The following sections would describe steps in building the simulation, as well as the utilized equations and the involved theory.
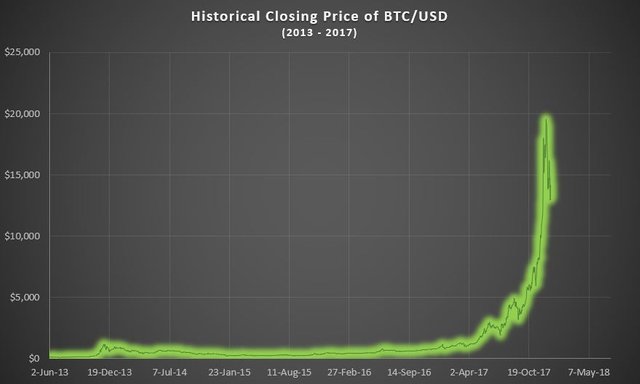
A. Historical Daily Closing Price Data of BTC/USD
First of all, we start to collect historical data of BTC/USD pair. The historical data is obtained from Coinmarketcap . Basically they generate the historical data by collecting OHLC (Open-High-Low-Close) prices from approximately 400 exchanges and then they calculate weighted average of each price to represent the adjusted OHLC price of Bitcoin. Thus, the data might slightly differs from certain exchange, however the price is considered still reliable for research purposes.
The obtained historical data would consist of timestamp, OHLC price, trading volume, and market capitalization in daily time-frame. In this article, we would like to utilize the data from 2nd June 2013 until 31 May 2018. However, firstly we only utilize the data from 2nd June 2013 until 31 Dec 2017 for conducting analysis in price forecasting on 2018. The data could be downloaded in attached link below.
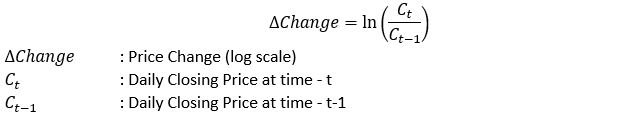
B. Calculate the Daily Logarithmic Price Change
Next, we calculate the daily price changes. Here, we try to calculate them in logarithmic way, because the price is such non-negative variable. Thus we prevent the price to be a negative value by calculating them using natural logarithmic function. Also, we assume that today closing price depends on yesterday closing price. So as you could see, there would be yesterday closing price as a known parameter exist in equation. The equation is provided below.
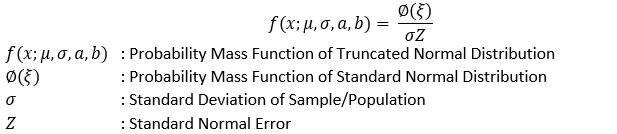
C. Generate Probability Density Function of Daily Logarithmic Price Change
In this article, we would like to use Truncated Normal Distribution as Probability Density Function (PDF) of daily price change. The major reason is this PDF matches to our modelling assumption which follows Central Limit Theorem (CLT) and Law of Large Numbers .The another reason is the distribution of population fits Truncated Normal Distribution based on Kolmogorov-Smirnov Test (K-S test) and Chi-Squared Test . The following equation is PDF equation of Truncated Normal Distribution.
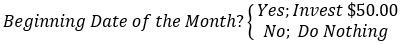
D. Generate Investment Rule in Accordance to DCA Method
Before we run the simulation, we need to adjust a rule for our investment. According to DCA method, we need to buy an investment regularly with the same amount (fixed) of buying at certain time scale, regardless of the investment price (see Section "Introduction to Dollar-Cost-Averaging (DCA) Method" on above). Thus, we start to simulate a regular monthly investment as much as $50.00. The investment would start every beginning of each month and sell at the closing price of December for each simulated year.
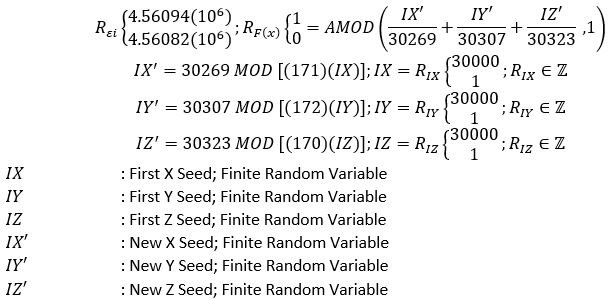
E. Generate Pseudo Random Number and Run the Simulation
In this article, Pseudo Random Number Generator (PRNG) would be utilized to generate randomness in possible market movement. The algorithm is described in the following equations.
F. Check the Convergence in Accordance to CLT and Law of Large Number
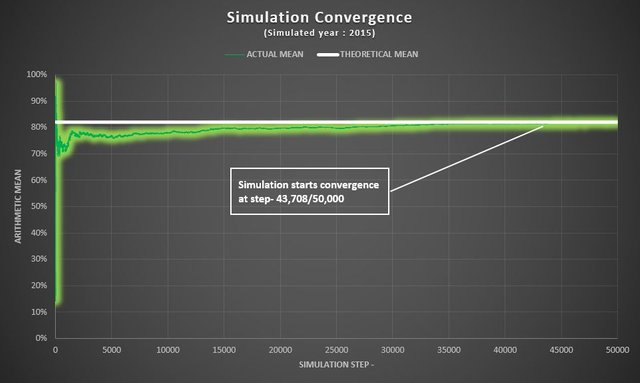
As aforementioned in section before, we assume the market movement would follow CLT and in accordance with Law of Large Numbers. The Law of Large Numbers is a principle of probability according to which the frequencies of events with the same likelihood of occurrence even out, given enough trials or instances. As the number of experiments increases, the actual ratio of outcomes will converge on the theoretical, or expected, ratio of outcomes.
Below, we have attached a chart which describes a convergence process of one of our simulations. As we could see on this chart, the simulation starts to converge at step- 43,708 from 50,000 total simulation steps.
Simulation Result
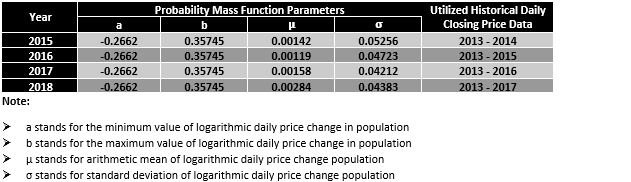
The table describes each parameters of utilized PDF for certain simulated year. It is foreseen that we only use specific historical data due to ignore degree of disturbance from actual data of simulated year. It is clear that minimum and maximum value of log daily changes are not different from year to year. However, the mean and standard deviation of each simulated year are slightly differs to each other as the new data added, this means new incorporated data makes a new population that more vary than prior population.
The result would be split into 2 (two) separated sections. The first section would contains "Back Test Result", this means we only elaborate the simulation result of 2015 until 2017 and then we try to compare with actual profit/loss data for each simulated year. Meanwhile, the second section would contains "Forward Test Result", this means we elaborate the simulation result of 2018 based on 2013 - 2017 as well as 2013 - 31 May 2018 daily historical data, and then we try to compare them in order to ensure the existence of significant changes in performed simulation.
Back Test Result
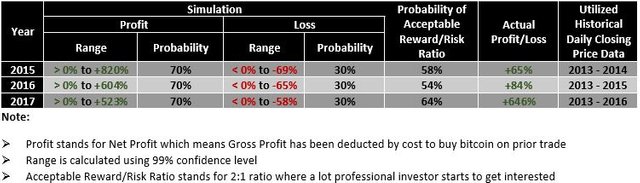
As we could see on the above table, we have simulated our investment in 2015, 2016 and 2017. According to simulation result, in 2015, we have 30% chance to lose our investment in range of < 0% up to -69%. This means that if we have invested $600.00 (total investment) to buy Bitcoin each month in 2015, then if market goes bearish in 2015, we might suffer maximum loss -69% or counted as much as $414.00 losses in our portfolio. In the other hand, we still have a chance around 70% to gain profit in our investment in range of > 0% up to +820%. Which means, we have chance to gain maximum profit +820% or counted as much as $4,920.00 from our investment (net profit).
Meanwhile, there is 58% chance for us to double our investment in 2015. However, the actual data shows that if we used DCA method to invest in Bitcoin in 2015, we gained +65% profit in our portfolio which means the value is still inside range of our simulation result.
Forward Test Result
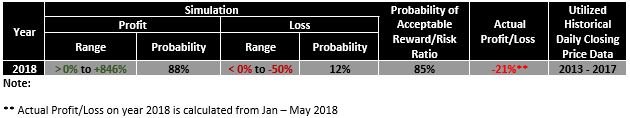
The first scenario of Forward Test is we simulate price movement in 2018 based on daily historical data of 2013 - 2017. It is foreseen that the result is surprisingly due to higher probability on profit region. According to the result, we have 88% chance to gain profit in range of > 0% up to +846% if we invest in Bitcoin in this year. However, there is also 12% chance to suffer loss in range of < 0% up to -50%. Surprisingly, the chance to double our investment on this year is counted to 85%. Since the first model only utilizes data from 2013 - 2017, it is better to compare with the latest data that we have obtained which is daily closing prices from 1 Jan 2018 - 31 May 2018. Next, we try to incorporate new data into our prior population, and run analysis to compare the latest result.
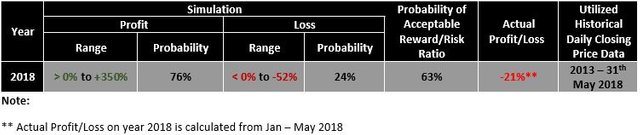
As we could see on the above table, profitability range is reduced significantly to +350% as well as probability of gain profit is also reduced to 76%. Meanwhile, loss range is not significantly change, however the probability of suffer loss is increased to 24% as well as the probability of acceptable reward/risk ratio. This proves that the updated data gives a significant changes to our simulation result.
Conclusion
- There is 12% - 24% probability to suffer a loss for investing in Bitcoin on 2018. The loss would probably lies in range of less than 0% up to approximately -50% of total investment.
- There is 76% - 88% probability to gain profit for investing in Bitcoin on 2018. The profit would probably lies in range of more than 0% up to approximately +350% (moderate judgement) of total investment.
Enclosure
Once again, this article is intended for educational purpose only. For me, investing in cryptocurrency need patience and DCA method suits me as the best way to invest in long term perspective. HODL-ing is the best way for me to keep away my emotion from high volatility market and depreciation in asset value on my investment portfolio.
This is only one of researches that I keep busy during my leisure time. I look forward to your suggestion in comments down below or you could send me a message. Thank you for having perused my article.


Congratulations @cryptobility! You received a personal award!
Click here to view your Board
Congratulations @cryptobility! You received a personal award!
You can view your badges on your Steem Board and compare to others on the Steem Ranking
Vote for @Steemitboard as a witness to get one more award and increased upvotes!