Bitcoin & Ethereum - Technical Analysis 🧐🎬
Morning Steemers and happy Sunday... I have 3 graphs for you today:
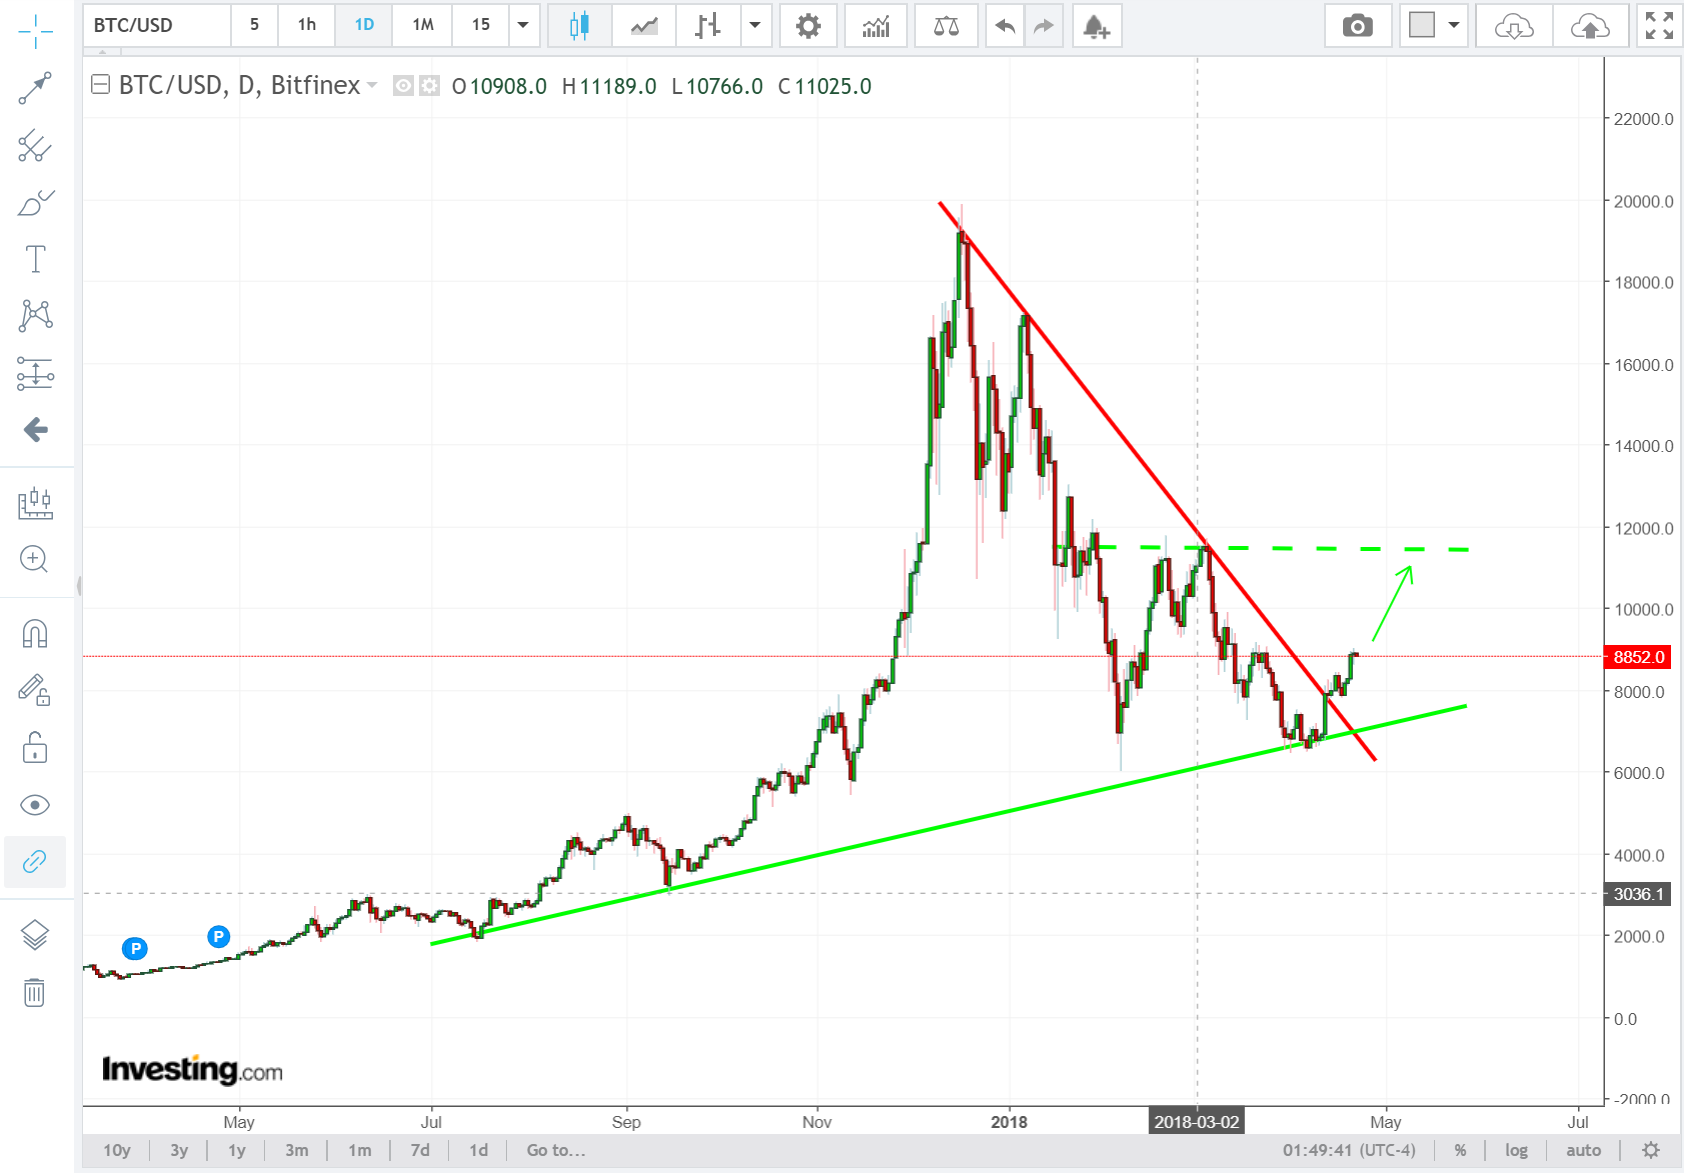
The first is the daily on Bitcoin. So as we can clearly see we found some support of the green trend line a couple days ago. We then proceeded to break through the downward trend line in red. In the technical analysis world this is a positive/bullish signal 😍. So now we can look for a retracement back to a previous local maximum. What this means is that we can trade back to a previous high. On the graph below I highlighted this with the green dashed lined. We need to see what happens then to make a call on the next move.🤔
The next one is a log graph on the Bitcoin monthly. I am showing you this just to confirm that the positive trend in Bitcoin as well as crypto currencies is still in place. The chart goes back to the early 2013s. Now you might ask why the trend line I plotted is linear. Well this is a log graph so if its linear on the log of price, its exponential on the price as we have seen. The growth curve is still firmly in place. The chart suggests that even had we gotten a move in Bitcoin to the $3500 level this still would have NOT invalidated the exponential growth curve. 🤓

The last graph if of Ethereum on the daily. It follows pretty much the same pattern as that of the Bitcoin daily. Support from a longer term green trend line and then a break through the red downward trend line. We look for a smaller move higher here to a previous support level which will now act as resistance, this is highlighted in the green dashed line.

All the best and happy trading... 😋😋


Very nice crypto currency
I like it this bitcoin crypto
I appreciate your valuable Post.......
thanks
Most welcome...
Love trading? iCoinCourse is the best software for traders!

Receive notifications when course grow up or grow down.
Download there: icoincourse.com