RE: Market Movement Tip - Chart Triangles
Here is one example from bitcoin's past:
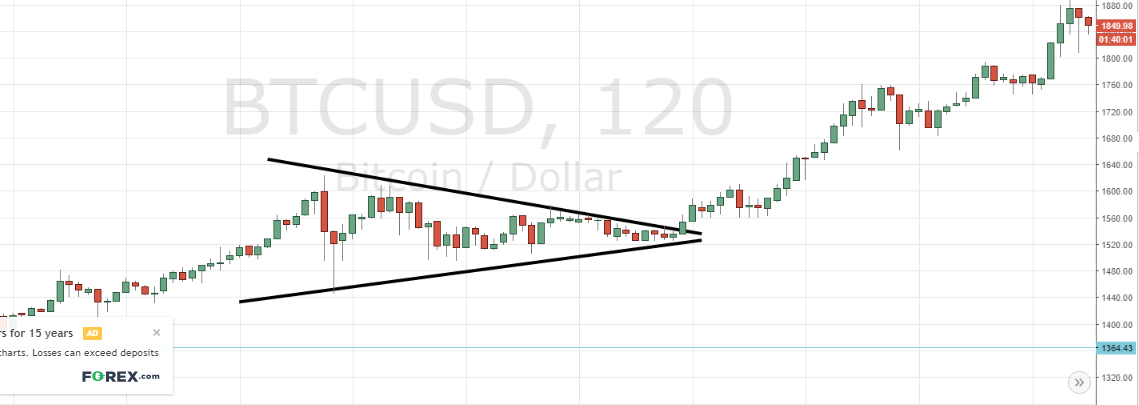
Really, the textbook on this would say something like, "this period is a period of indecision, where forces for both selling and buying (bull and bear) are duking it out, shuffling prices between ranges, ultimately one side wins rather than a continuation of the struggle indefinitely. To push price down, there must be sellers. To push it up, there must be buyers. When range of buying/selling eventually collapses, a winner must emerge, ultimately dictating the future of pricing."
That said, as a trader, you might only swing trade that for a few days and then decide you no longer know where prices are headed. It's not much of a window of visibility, and they break either up or down, and swing in a given direction. That swing does not have to continue, depending on the situation.
Thanks for that very informative response. I'm getting the feeling though that this swing is coming very soon. The majority of people expect that come next week the the swing should break upwards especially since a lot of BTC drama for now seems to be over. However, I know that there's always a possibility that it may not do that and break downwards instead.