You are viewing a single comment's thread from:
RE: BitShares (BTS) is Following the Prescribed a,b,c,d,e Pathway Pretty Well!!
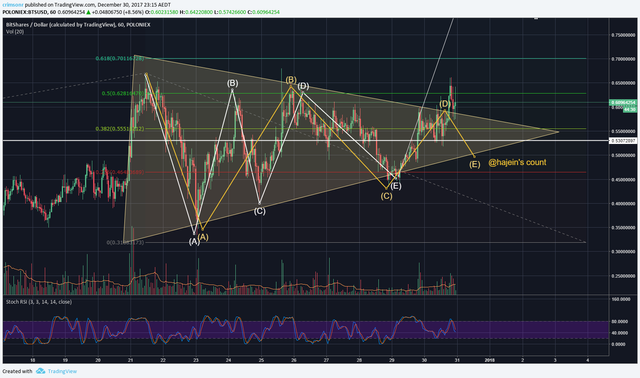
Quick update; we have almost broken out of the triangle. If it does, this could be a big run up!
Quick update; we have almost broken out of the triangle. If it does, this could be a big run up!
This does not seem to be right. I feel like @Haejin's prediction was correct.
What in particular is does not seem right to you?
@haejin has a wealth of knowledge and experience on me, so I would not be surprised if he turned out to be correct!
I'm just throwing some ideas out there to learn and get feedback.
So should we sell our BTS holdings and wait for the correction to finish then buy back into BTS? I bought in at 60$ per share btw.
I can't tell you when to buy or sell, but when people ask me this I ask them are they investing or day trading.
If it's the former, you hold until it reaches some longer term profit target. You won't be concerned with day to day fluctuations in price because you think long term it will be much higher than you bought in.
If it's the latter, then set a short term profit target and a stop loss. That way you manage your risk and take a small loss if you are wrong, and you make a modest amount of profit in a short period if you are right.
ABCDE is not complete yet.
Hm, looks complete to me. Problem is it struggles with breaking out of triangle now. Is kinda dribbling on the upper triangle line.
[edit] - ah, I understand You now. You mean B and C in @crimsonronin chart might be just subwaves of real B and that would place us now at the top of D. Could be.
That is exactly what I was talking about.
Yeah I agree, it's looking more and more likely now.
I kept my original count and added @haejin's for reference.
It had momentum but couldn't break out, so I think it will retest the lower end for support
As of now, this is not correct anymore. I believe it is ascending triangle we are seeing. Once E is complete, I will be casting buy ladders.
Happy holidays.
Just an update.
I'll re-chart as an ascending triangle/wedge, but that isn't exactly bullish....
It looks probable. How ever i am leaning towards @haejins's alternate count on BTS/BTC head & shoulders. Then how would this effect BTS/dollar?
I don't often chart BTC pairs because it can mean a few different things:
I believe most people still, even if it's just at a conceptual level, translate BTC value back to USD anyway.
So, if BTCBTS completes the H&S it could still mean a higher BTSUSD value -- it just depends how high BTC goes vs USD, and how low the BTCBTS ratio goes. This is why I stick to USD charts as it becomes messy.
@crimsonronin What software do you use?
Think he is using tradingview.com, it is a good one but I prefer coinigy.com, many use both because not all coins are avaliable on each :)
Hope this helps.
Correct; I'm using tradingview.com
look like you made some money in the stock market as well.