Bitcoin price analysis (BTC) 05/11/2018
Bitcoin price analysis (BTC) 05/11/2018

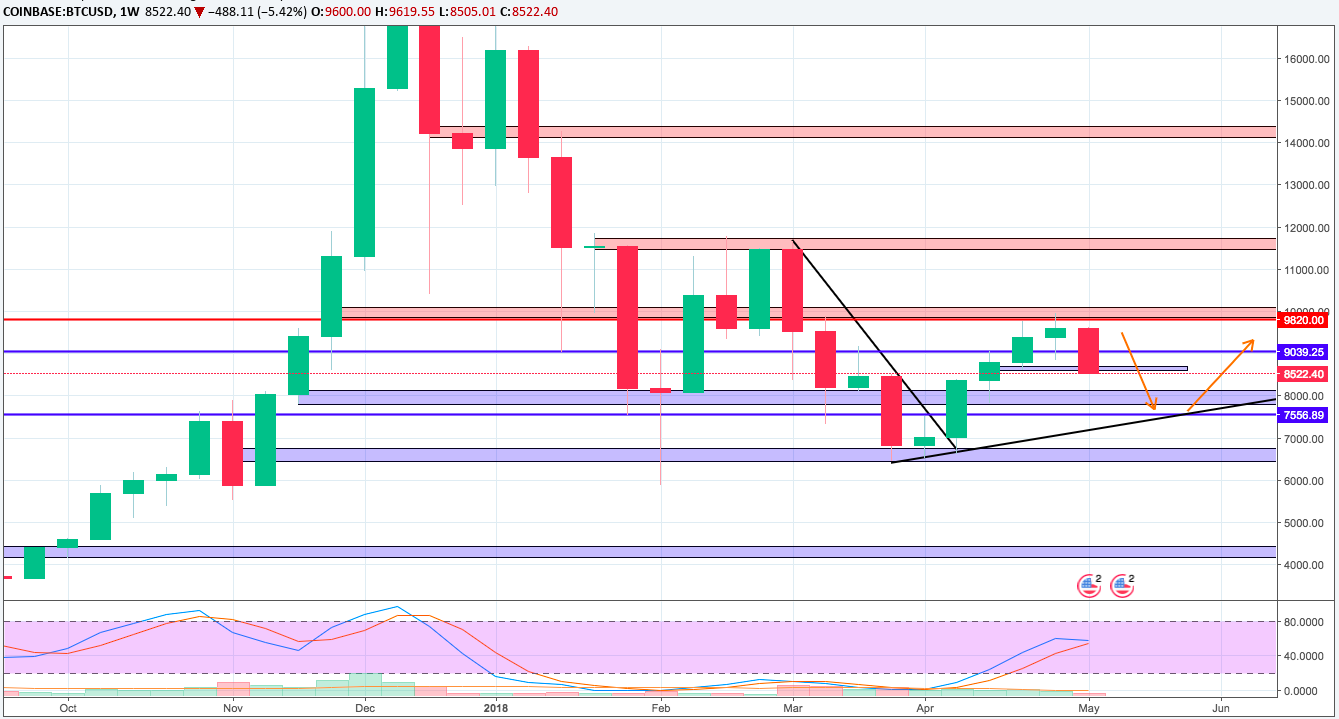
The Bitcoin bulls (BTC) continue to struggle, leading to the creation of a complex head and shoulder pattern visible within the 4 hour time frame. The price has not yet broken below the neckline around $ 9000 to confirm that a downward trend is underway.
The 100 SMA is above the 200 SMA in the longer term to indicate that the path of least resistance is upward. This suggests that the upward trend is more likely to resume than the reverse. However, the gap is narrowing to indicate a bullish momentum that weakens, while the price is below the simple average of 100 as an early signal of a return on sellers.
A break below the neckline could cause the Bitcoin (BTC) to fall to the same height as the chart formation, which ranges between $ 9,000 and $ 10,000. The SMA 200 dynamic inflection point could also serve as a support.
The RSI tilts down to show that sellers have the advantage, but the oscillator also plunges into overbooked territory to reflect the sellout. Going back could attract buyers and lead another movement towards resistance around $ 9750-10,000.

Bitcoin seems to have seen less than the previous portion of positive updates this week, which started on a bitter note thanks to Warren Buffet's comments. Still, it is worth noting that market players expect an influx of institutional funds as ICE is planning to launch a bitcoin trading platform.
However, geopolitical risk seems to have attenuated the demand for cryptocurrencies, and BTCUSD seems to have disregarded the recent massive sale of dollars for a weaker CPI.
Analysts continue to forecast more profits for bitcoin, with Thomas Lee forecasting that it could reach $ 36,000 by the end of the year and Fundstrat setting an estimated $ 64,000 for next year. According to Sam Doctor, head of data science research:
"We believe that the current hash power growth route supports a BTC price of approximately $ 36,000 by the end of the year 2019, with a range of $ 20,000- $ 64,000."
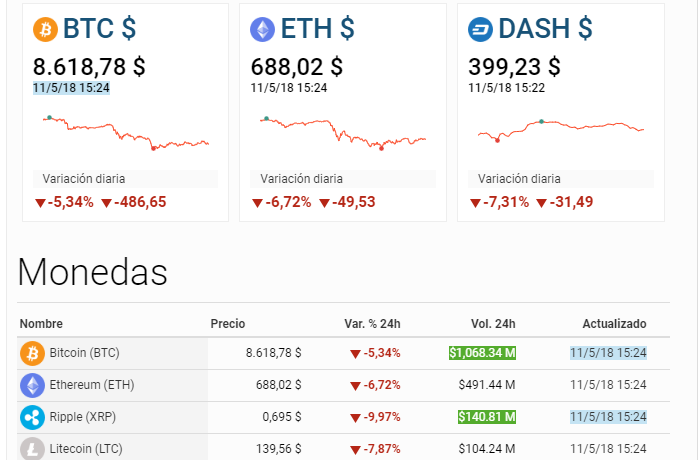
Other currencies:

Thanks for sharing your analyze. Everyone who are in crypto world wondering about bitcoin. Useful post.
Looking like a drop towards $7,500, weekly showing strong signs of bears.