Price Analysis March 16: Forecast on Bitcoin, BTC/USDT
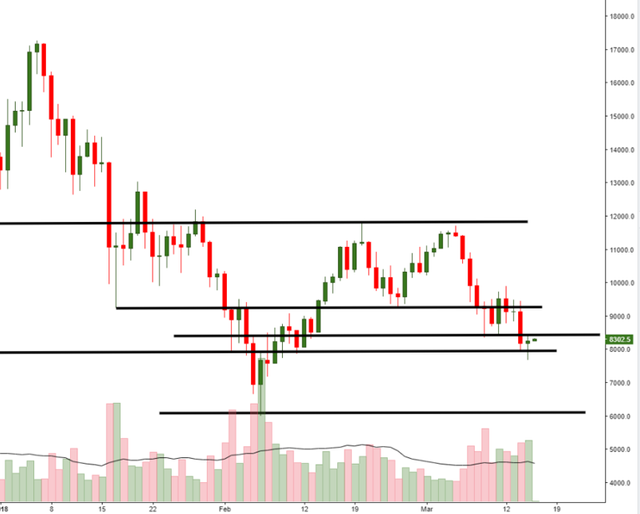
- The daily chart shows an absorption but limited by overhead resistance.
- Sellers remain well in control, bounces seen as selling opportunities.
- Renewed selling may see an eventual target of $6k.
BTC/USDT - Access Full Scale Chart via TradingView
On the daily, the absorption at a key level of support implies the potential for a short-term recovery within the context of a bearish downtrend. Should Bitcoin find some fresh legs higher, the rebound may see the prospects of a retest towards $9k-$9.3k should the area of resistance overhead be broken. The failure to close below $8k by sellers is a partial short-term defeat that short-term traders may look to capitalize on.
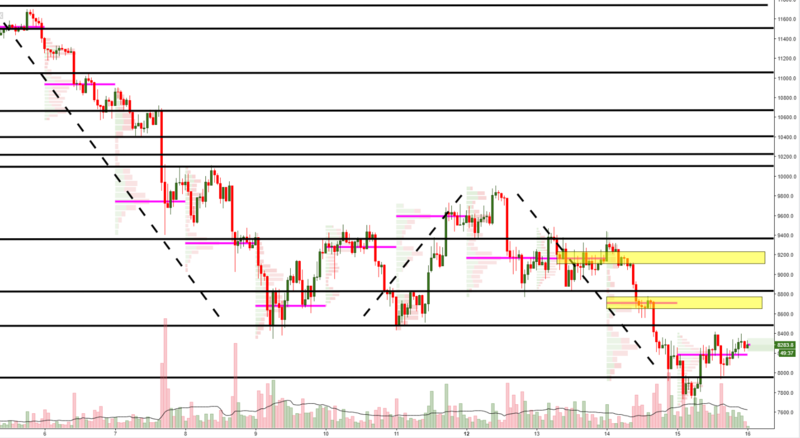
On the hourly, the bearish cycle remains very much in place, with the minor rebound off lows now facing a major area of resistance at $8.3-8.5k. At this stage, any rebound should be perceived as an opportunity for sellers to engage in short-sided business to capitalize on the current negative sentiment. Note, in the lower timeframes, there is still not enough evidence suggesting a more meaningful recovery.
The next area of resistance can be found at $8.5k ahead of $8.7k POC (Point of Control), followed by an immediate hurdle overhead at $8.8k (horizontal line). Remember the caveats on the way down, that is, a break and hold sub $8k will most likely take its toll on the confidence of buyers, not likely to engage with enough conviction to outweigh the selling flows until levels as low as $6k.
Don’t miss out on daily crypto insights, in depth research and exclusive interviews! Subscribe to our newsletter here!
Footnotes:
Given the discrepancies in price levels on different exchanges, in order to keep our technical studies consistent, the chart selected for analysis is generally the dominant by trading volume. Extrapolate levels to your own respective charts.
The dash lines are utilized to represent the latest cycles. Markets tend to move in cycles of 3 followed by a period of distribution and/or accumulation. Cycles are repetitive patterns that provide both market magnitude and timing studies.
The volume profile analysis tracks trading activity over a specified time period at specified price levels. The study reveals dominant and/or significant price levels based on volume. This process allows understanding market opacity.
The yellow rectangles in the chart represent the areas of most interest by trading volume, and should act as walls of bids/offers that may result in price reversals.
Technical analysis is subject to fundamental-led news (inter-dependent). Any unexpected news may cause the price to behave erratically in the short term, while still respecting the most distant price references given.
Congratulations @coinlive! You received a personal award!
Click here to view your Board
Congratulations @coinlive! You received a personal award!
You can view your badges on your Steem Board and compare to others on the Steem Ranking
Vote for @Steemitboard as a witness to get one more award and increased upvotes!