It was so EASY to sell BTC today at $2700 before the crash...you just needed to be awake! I will show you how.
Through over 10 years of Day Trading I've acquired some pretty handy skills that can be used for scenarios such as this. I saw the writing on the wall as Bitcoin was making a huge push day over day. I started making posts on Instagram giving Technical Analysis on a near term top 2 days in advance. You will see charts and my thought process leading up to the final dollar before Bitcoin reversed. While this won't help you right this second, there will be a next big push and you will maximize your trade as I did. Its quite simple to see. You also need to understand how market forces are reacting to price action.
IF YOU WERE UP THE WEE HOURS OF THIS MORNING, BY THE END OF THIS POST, YOU WOULD'VE RECOGNIZED AND SOLD FOR A HEFTY PROFIT.
So here we are. I will start out with the Weekly Chart. Btw I love www.bitcoinwisdom.com's charts. A great look and all the time frames you need.
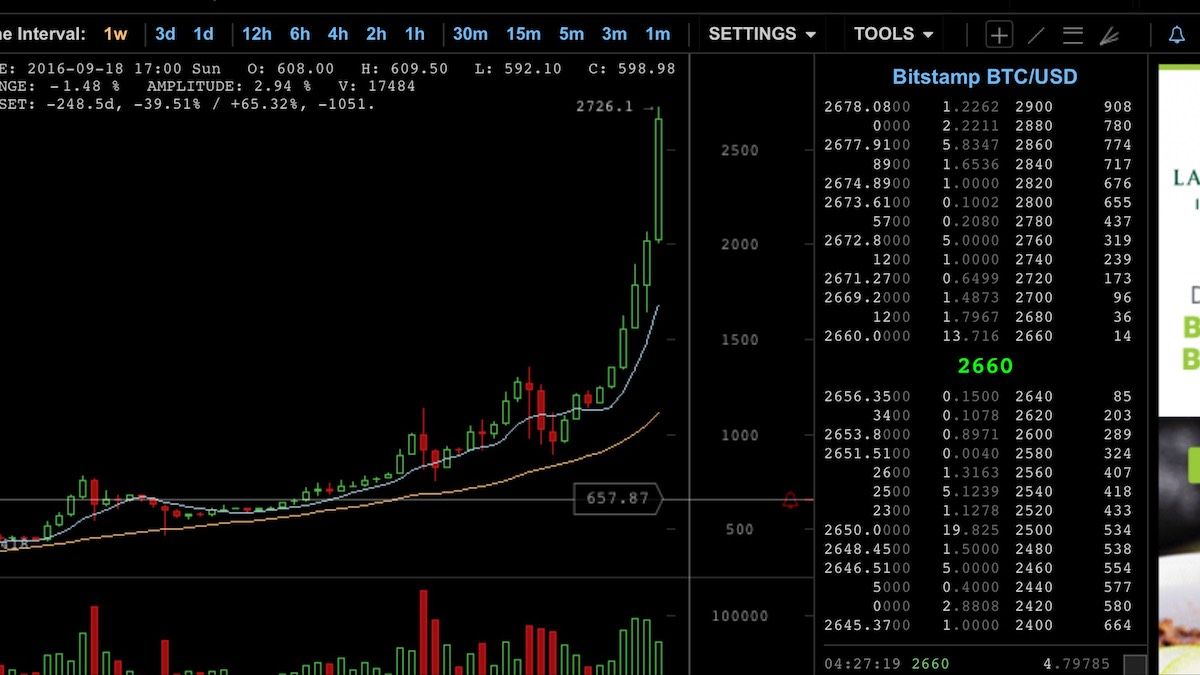
And what a Chart this is. Crypto is a BEAUTIFUL world. You will notice a few things.
- Each "candle" is 1 full week of trading. Later on when I talk about 6 hr, 4hr, and so on it means each candle represents the price action in a set period.
- 10 weeks ago Bitcoin was under $1000. Pretty hard to believe right?
- The last 6 weeks have all been gains.
- The last candle is HUGE and way out ahead of everything. It looks like its reaching for the sky.
So what happened? If your on here you know more than most. Japan, Ethereum ETF, China, and US demand. Also momentum players looking for quick money. We will come back to all of those in a bit.
Charts with different time frames give you different insights. Kinda like in Biology when you look at a specimen under a microscope. you get to see all the microscopic elements shuffling around even though from the naked eye nothing is moving.
Lets take a closer look with a 6hr Chart that was leading up to the top.
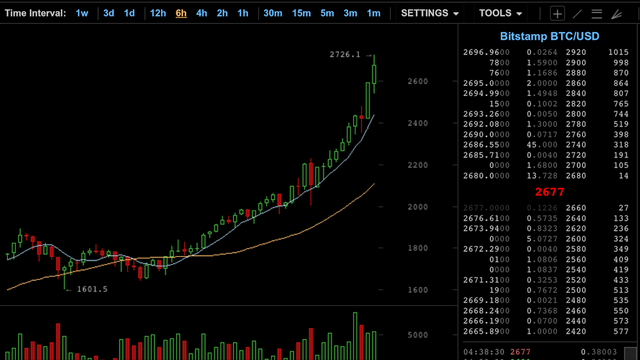
To the untrained eye you might say that everything looks great but this was already causing me some concern. We already talked about the candle being far away from any other candle. This brings me to pitch. The chart was moving up aggressively, but if you squint you can see the last 3 or so candles ramp up even more aggressively. We, in the trading community, call this "Parabolic." Basically the price is going vertical. Straight up.
Here is where momentum enters the conversation. We have all seen a rocket ship take off right? It goes straight up. Have you ever heard anyone talk about how much fuel it takes to get the vessel out of our atmosphere. An enormous amount. it takes even more to continue propelling it upwards because of the weight and gravity. Same thought process applies here. Once it starts moving straight up, it takes tremendous buying power to keep it going in that direction. This is unsustainable.
Why?
Market forces. You don't have to be a brain surgeon to trade like a pro. Think as if there are 1 million clones of you. How would that affect prices? There were plenty of people who saw the same thing I saw in these charts. Add onto that there were plenty of people who literally doubled there entire position in days. Add those 2 things up and of course they are going to sell.
What happens when the smart money starts selling? The ones who don't know whats going on panic and sell right along with them. Relatively speaking, there aren't very many Bitcoins floating around. So when enough selling comes in, it will definitely crash the price hard. We have seen this numerous times. If the price were 1 million dollars per Bitcoin we would be in a much stabler environment but we aren't there yet.
Next: When to sell. Here is the 4 hour chart after the selloff but was the key decision to sell.
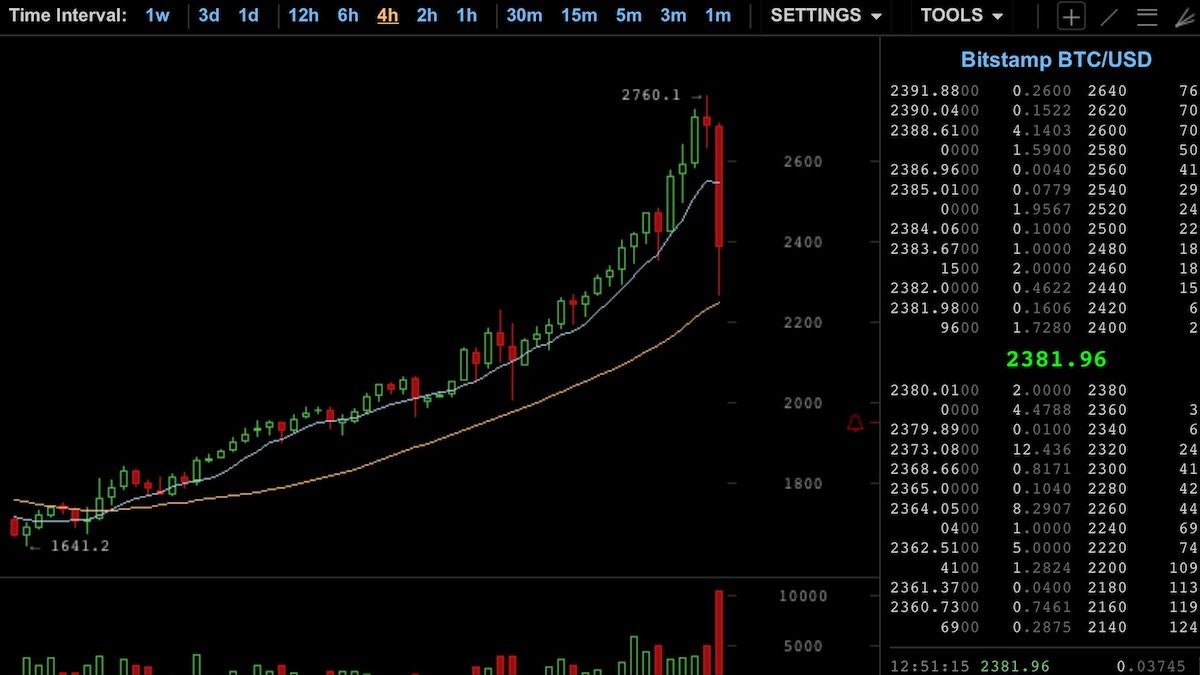
Look at that BEAUTIFUL red candle sitting nice and high with a glaring sell signal if you just looked at the 4 hr chart. I prefer nothing less than the 1hr chart with bitcoin as it is so wild. But on a 4 hour chart? Easiest decision I ever made. I combined everything we already talked about above into technical analysis to spit out the final answer...I need to sell now. The last important point I'll make before I summarize is that different charts show you different things. You might see a 4 hour chart and it tells you nothing only to move to a 6 hr view to see everything you need to know. So jump around!
We see what happened next and the next hours after that but you can avoid this. To summarize:
- Know why it is moving up.
- Know that no matter how great of an idea or product it is, nothing goes up in a straight line.
2a. Expect people to take profits if it is a crazy move up. - Look at the charts. If candles start out small and build to enormous candles you know you are getting close
3a. Look at the volume at the bottom of the chart. If Volume spikes with the Price, you are near a top. - Find a big candle, use smaller time frames and look for the change in pitch to something parabolic.
- When 1-4 is complete look for a nice time frame where you get a clear view of momentum.
- Sell your position but have a re-entry in case you are wrong so you don't miss out on more upside!
Lastly Lastly I will leave you with a famous but accurate quote. "Prices take the stairs up and the elevator down. "
Thank you for that @coinhawk
We can never learn enough about trading. Especially to recognize hot moves like this one!
good stuff
Thanks
Beautiful explanation of timing the market top
Thanks. I use advanced algos when I'm Day Trading but when there is a blowoff top or a waterfall decline the best thing you can do is get simple, Once you see it going straight up or down with heavy volume there is a point where buyers or sellers get exhausted and all that is left is the opposite. The reversal is clear as day.
Wonderful post!
Point 6 of your conclusion: May you explain how to do it on poloniex, I guess it is with the Stop-Limit Box, but I have no clue about it. Thanks!
Exactly. A stop limit means you can maintain your current position. If the price falls and hits the stop limit price you enter, the sale of you coins happens automatically so you don't lose more money. Sometimes you are just not around a computer when the market moves. You can also take the stop loss off whenever you want. Move it up or down. Pretty much whatever scenario you want. Hope this helps
Great! This helps a lot.
Great advice! Thank you, @coinhawk. Hope to swallow more of your nectar in the future.
Am I allowed to translate your advice into German?
Sure :)
Thank you very much.
This is great analysis for those of us who don't work charts like this for a living. You just made it really simple to understand in layman's terms.
Thanks!