assumption, graphs based on previous actions or on mathematical analysis, in the dangm case, the triangle, breaking up above 11K will give a positive momentum, found another unusual method y=√x instead of trend lines and what happened
this experiment, everyone wants to know where bitcoin will go, for this they invent and compare anything, I liked the analysis and I put it up, but it does not quite fit the answer,but focuses on the fact that the price will reach new heights soon and the specified resistance can be the starting point ,I showed the picture in a small and large period of time
assumption, graphs based on previous actions or on mathematical analysis, in the dangm case, the triangle, breaking up above 11K will give a positive momentum, found another unusual method y=√x instead of trend lines and what happened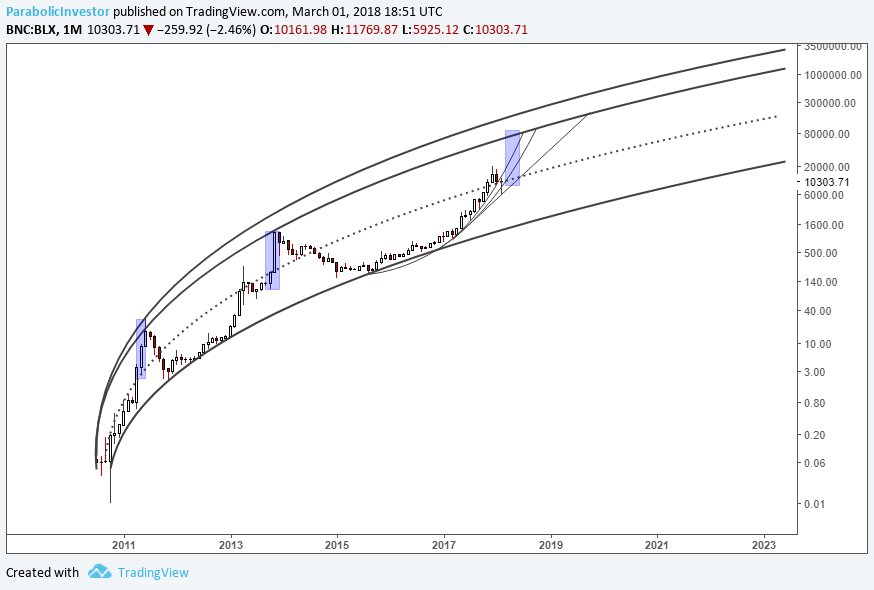
I'm confused, this is a chart for a completely different pairing.
this experiment, everyone wants to know where bitcoin will go, for this they invent and compare anything, I liked the analysis and I put it up, but it does not quite fit the answer,but focuses on the fact that the price will reach new heights soon and the specified resistance can be the starting point ,I showed the picture in a small and large period of time