Bitcoin is Forming a Hammer Candlestick on the Weekly Chart - Bullish Signal?
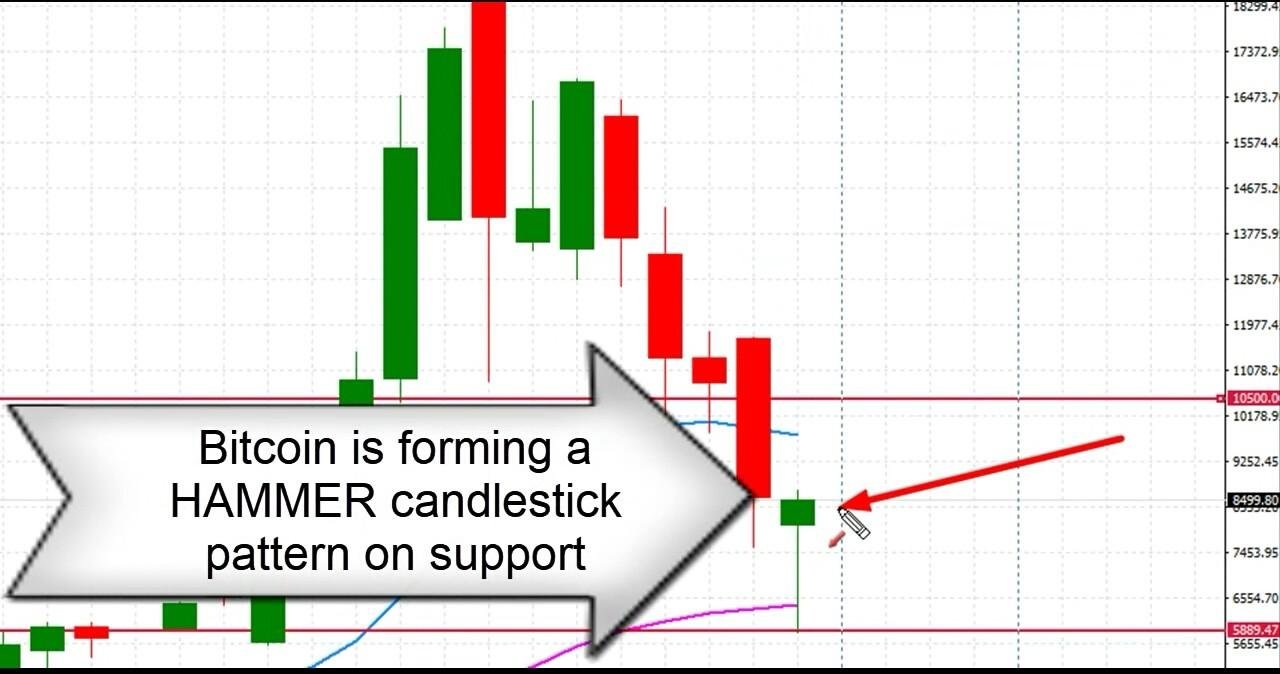
I noticed an interesting development on the weekly charts for bitcoin. A "Hammer Candlestick" formation has formed following the bounce off last week's low on the 55 Weekly EMA.

According to most traders and pattern theorists, this is a bullish signal and does provide a strong probability that we will see bitcoin's price continue higher in the coming weeks, so long as the buyers continue supporting the market and suppressing the sellers.

Bitcoin had a similar formation way back in 2015 as indicated above. Again the price at that time bounced off the >quote55 Weekly EMA.
Let's see what the coming weeks bring. Peace.
Nice, just a little while ago I was reading about candlesticks and the hamer was the first explained, I/We all hope to see a long posposed uptrend in BTC as well in the other alts.
Good for you. I tend not to favour the various candlestick shapes and patterns too much, but on certain occasions such as now and with the hammer candlestick in particular, I thought it was quite interesting to see.
I'm bullish on BTC, and subsequently if it rises steadily over the coming weeks we should see a positive bull trend for the Altcoin markets.
good
Thank you.