Future Bitcoin prices, massive bull run expected to end in late June
It’s been an exhaustive 20+ days of watching time cycle after time cycle complete. It’s been exhaustive watching geometric angle after geometric angle complete. It’s been very interesting watching the astronomical phenomena finally complete the reversal process. But where does Bitcoin go from here? How far can it go and when will the next high be in? That’s what this analysis is.
Forecasting is tricky. When dealing with horizontal or angled price projections, it’s easy to spot where a support or resistance area can be. Forecasting an event is more difficult. Forecasting with Fundamentals is pointless and worthless. All Fundamental Analysis is lagging information. Technical Analysis is a mix of lagging and leading information. Financial Astrology is entirely future based. Technical Analysis alone is often enough to identify certain trend changes within a 1 to 2 year period. Myself, I’ve only ever been accurate up to a year. I am astounded with how accurate some of the modern, expert, Gann analysts have been with their forecasts. For me, I like to use Gann, Hurst and Elliot.
Gann and Hurst tell me when something may happen: “When will there be a pullback?” “How soon until the reversal happens?”
Elliot tells me how far price can go, or the range: “If I know that in mid-June we will have a swing high for the year, what price range will that be?
Bitcoin Forecast – Financial Astrology Analysis

I first want to call your attention to the blue semi-circle lines (they look like humps). These are called synodic cycles. This is the measurement between two planets aspects, converted onto a price chart and then repeated as a cycle. If you are familiar with Hurst Cycles then this looks familiar. If not, then just know that the troughs (bottom of the semicircle) often represents a swing low in price. Observe also that the top of the semicircle or the top of the hump often reveals a swing high in price.
The cycle on this chart is the Mars-Saturn synodic cycle.

Let’s also review the other components on this chart
The wavy lines represent the longitudinal angle of Mars, the green line is the primary line of Mars and reds lines are the harmonics between two Mars lines. These lines are called Gann Planetary Lines (GPLs). Gann had a formula for transposing the angles of a planet onto a stock chart. Thankfully, the software I am using (Optuma by Market Analyst) already has this calculation done for me.
The thin aqua columns represent the planetary aspect of Mars Opposition Venus. Mars is important to stocks and options. Mars is the ‘key to timing’ according to Gann. Mars represents action. Mars also represents conflict and contrarian views. Venus is important in bonds. This aspect has never been observed in Bitcoin’s history. Watch it.
The orange column represents a number of retrogrades, I used this one as a placeholder for the absolute metric crap storm that happens here.
a. Saturn is retrograde from April 18th to September 6th. When Saturn is in retrograde, bad stuff hits the markets. This indicates initial bullishness for Bitcoin but fades in late June.
b. Mercury is retrograde from July 26th to August 18th. This is a simple: Don’t effing trade this effing period. Period.
c. Jupiter’s retrograde cycle (Which we are in, and have been in since March 9th, 2018) ends on July 10th. Jupiter retrograde indicates a ‘time out’ in the market. Bitcoin seems to see during Jupiter retrogrades.You may or may not see them, but there are small circles on the chart. They are solar eclipses. July 13th and August 11th are two Solar Eclipses. These are powerful signals especially if markets are at or near all-time highs/lows are or are near historically important price levels. Things change directions here.
Next, let’s review the Gann analysis.
Bitcoin Forecast – Gann Analysis

Gann provided a number of significant dates and certain counts of days (calendar days and trading days) from particular highs and lows. These days also represent angles, just as price does. Gann’s Square of 9, Wheel of 24 (Gann’s Universal Clock), Square of 4 and many others can be used to assist in forecasting specific dates where price and time intersect, showing a very high rate of accuracy in determining where markets will reverse. (Note – the red circle indicates the end of the 192 Law of Vibration Cycle).
Square of 9 Price Angles
a. Price likes to move in a circle. Each price has a particular angle that it falls on. If price is at a 360-degree angle, this represents very strong resistance or support. Basically, when price reaches that level, expect a strong probability of a rejection from that price level. These are the following 360-degree price levels: $17,312.428 and $32,769.952.
b. Square of 9 and Wheel of 24 image below.
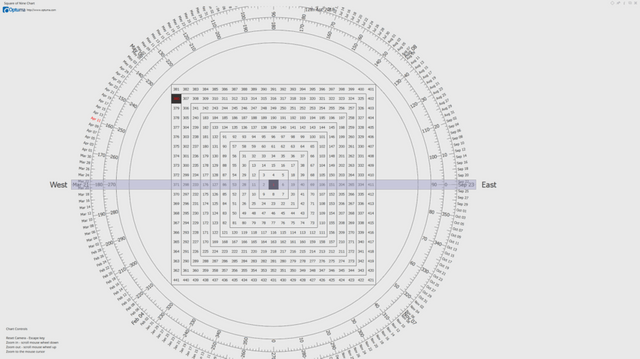
Square of 9 Date Angles
a. Just like price, every calendar days has an angle attached to it. June 22nd is exactly 90 degrees on the Square of 9. Gann said June 22nd, “is 93 days from March 21st, equal to a 90-degree angle. Summer starts, 180-degrees from December 22nd”. That quote is not verbatim, but it looks really official when it’s italicized. The content is true though.
b. Expect trend changes on this date if markets have been trending.Specific Gann Dates
a. Besides June 22nd, the next closest date is July 7th, which Gann said, “is 15 days from June 22nd. It is the next most important date after January 22nd. July 7th is 180 days from January 22nd. Advances or declines often culminate, watch for trends.”The Law of Vibration
a. I feel like I’m giving a lot of stuff away for free here, but I assume most people have trodded off to safety after the first part of this article concerning Financial Astrology. It’s probably safer if you did walk away. It’s less weird. Anyway.
b. Gann’s Law of Vibration is a headache of a thing to try to explain in detail, so let’s just say its a 192-calendar day count. From a historic or recently significant (yearly) high or low, you plot 192 days after that event.
c. 192 days from the all-time high on December 17th, 2017 is June 28th, 2018.Gann Day Counts
a. 135-day cycle: This cycle shows up on June 22nd, 2018, which is 135 days from the swing low of $5873 made on February 6th, 2018. The 135-day cycle can be the last hight, or, more typically, a lower high which ends in a topping pattern. If a high was found at 90-days, then 135 would also be 45 days from a high (vice versa). Always watch for changes in a trend. Fast moves can start. Can go from a high to a higher high or a low to a lower low.
b. 144-day cycle: This cycle shows up on July 1st, 2018, which is 144 days from the swing low I mentioned above. This date can terminate moves. And I mean they stop in their tracks, dead stop, total violent and full reversal. Watch it closely.


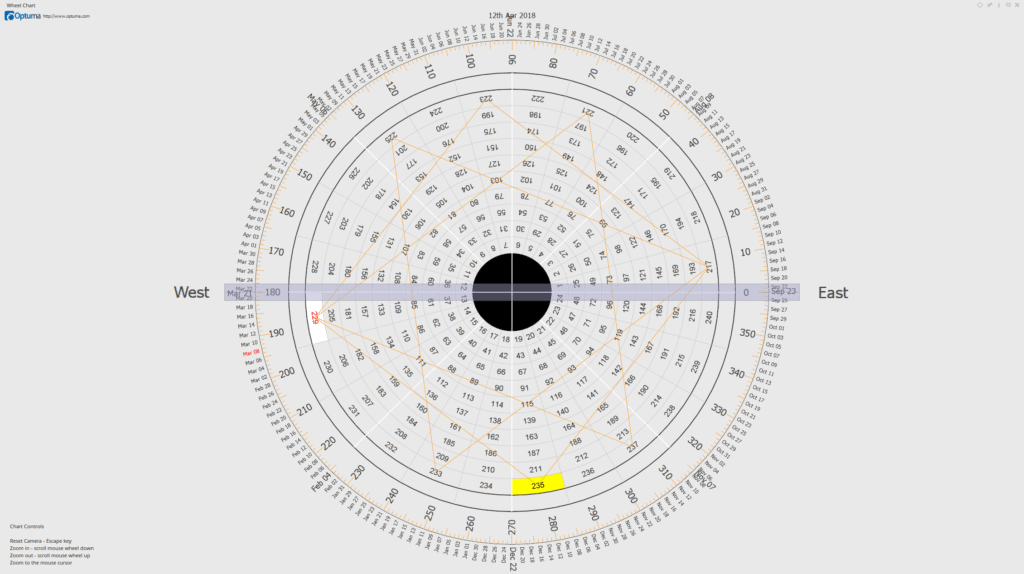
Bitcoin Forecast – Elliot Wave and Hurst Cycles

To answer the question: “How far will price go?” we look to Elliot. The date is not important, but the forecasted price range is. That level is near the $31,000 value area. Personally, I think that is a little to hopeful bordering on insane, but it is within the forecasting guidelines.
The part that may not be familiar to everyone is the hurst cycles. I’ve limited the noise on this chart to just show the horizontal lines on the extreme top of the chart and the extreme bottom. Each of those horitzonal lines represents a time cycle (think of the synodic cycles at the beginning of the post). There is a 40-week, 20-week, 80-day, 40-day and 20-day cycle. The culmination of probable tops is within the date range of June 23rd to September 19th.
What in Pluto’s name does all of this mean?!
Let’s make it simple and form a conclusion.
Reversal Date: June 28th, 2018
Considering the data, we should conclude that a market top will happen sometime around the last week and a half of June, possibly later in early July. for a specific date, I am looking at June 28th.
Highest target price: $30,731 – $31,000
Based on the angles and principles of the next motive wave in Elliot Wave theory, we should anticipate the extreme swing high to be around the $31,000 value area.
Special Note: The most important component of this analysis is not the price range, it is identifying a date range where we can begin to see when the next corrective wave/bear move begins.
i really hope so.. the turmoil in the crypto market has been unpredictable.
maybe bull run starting now we will see upvoted and following
hopefully the price starts to rise and doesnt stop again