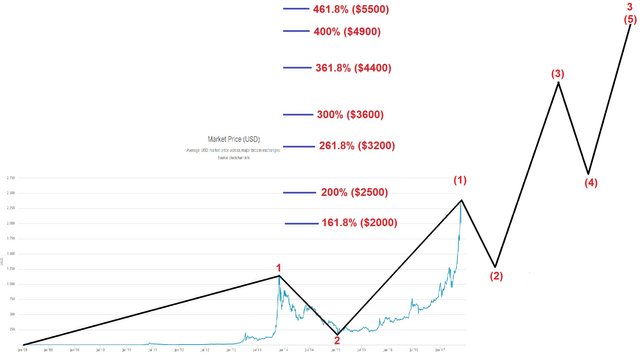
Bitcoin technical price analysis from 2009-2017

The analysis below is based on Elliot Wave Theory and Fibonacci mathematics. This analysis will show you what the most likely scenario is for the next couple of years:
Short-term (2017):
Move (1):
We are currently in potential move (1) of 5 sub moves that make up a multi-year move 3 (move 1 took about 5 years and ended in November 2013).
Price target: $2500-$3000 is a realistic target for move (1), but if the buying power stays especially strong, move (1) can get extended to $3000-$5000 or even $10,000. June will probably show us if move (1) is over.
Mid-term (2017-2022):
Move (2):
After we established the end of move (1), there will be a pullback move (2). Move (2) will most likely take about 6 months to complete.
Price target: If move (1) doesn't end well way above $5000, the price will most likely test $1000-$1200 again (end of previous multi-year move 1). It's also possible Bitcoin has become so strong that it doesn't even retrace 50% of move (1) and stays well above that.
Move (3):
Move (3) is usually longer than move (1).
Price target: The length of move (3) will most likely be 100%-200% of move (1). 161.8% a well known Fibonacci extension level.
Move (4):
Move (4) will usually retrace between 50-70% of move (3).
Price target: approximately 50% of move (3) and the end of move (1) at the lowest.
Move (5):
Move (5) will usually be smaller than move (3).
Price target: usually less than 100% of move (3)
Move 3:
This completes the second big move in Bitcoin. The first move took from 2009 till November 2013.
Price target: Move 3 will most likely end on any of the Fibonacci extension levels shown in the image above, unless move (1) and/or (3) are so strong the price already passed $5000. In that case we are dealing with an unbelievably strong trend, because not many financial instruments go above 461.8% Fibonacci extensions!
Long-term (2022+)
Move 4 & 5:
This is so far away that it's not even worth talking about. Bitcoin could be anywhere between $0 and $1,000,000 by then so we will have to see how the next 2-3 years develop before we can come to any reasonable conclusion on the matter.
[Important notes]:
Impulse wave ratios and durations:
3 out of the 4 impulse waves in Bitcoin since 2009 have been roughly a factor 10-15 (1000-1500%) price increase. It's a good base to use in the next years! The first move went from $1 to $30+ which was an exception. Generally the stronger the move, the longer the cooling down period.
Corrective moves (2) and (4) are expected to take about 6 months. The more the price increased in an impulsive move, the longer it takes to cool down and start the next move. Impulse moves are fairly quick as the name implies. Corrections can take considerably longer.
Pattern invalidation:
If move (4) closes well below the end of move (1) then this whole pattern has become invalid and we need to create a new count.
Rule of alteration:
The rule of alteration implies that if move (2) retraces quick and strong, then move (4) will most likely take way longer while price stays relatively stable during a long period of time. Taking Bitcoin as an example it could mean if move (2) takes 6 months and retraced all the way to $1200, then move (4) could take almost 2 years while the price stays between $2500 and $3000.
Extensions:
Extensions can make trends go on and on and on which makes it harder to count the waves. But don't worry, it's a good thing since the price grows higher than expected!
Don't forget to follow, resteem and browse my channel for more information!
Very interesting, thanks for posting - Voted & following!
Great analysis. I like how you included the possibility of two scenarios, what that would mean for the bigger picture, and how the month of June will really dictate that. Well done!