A Look At Today's Bearish Momentum - BTC/USD
Overnight on Monday January 15th to Tuesday January 16th markets saw a nice decline on some fundamental and China/Korea related news releases. With fear striking the market a lot of coins declined around 10-20% on average, according to www.coinmarketcap.com
Today we will look at the technical side of things; and high light the supply and demand zones that have been forming over the last few weeks to help make you aware of potential zones to expect reactions.
So let's take a look at 4 hour chart.
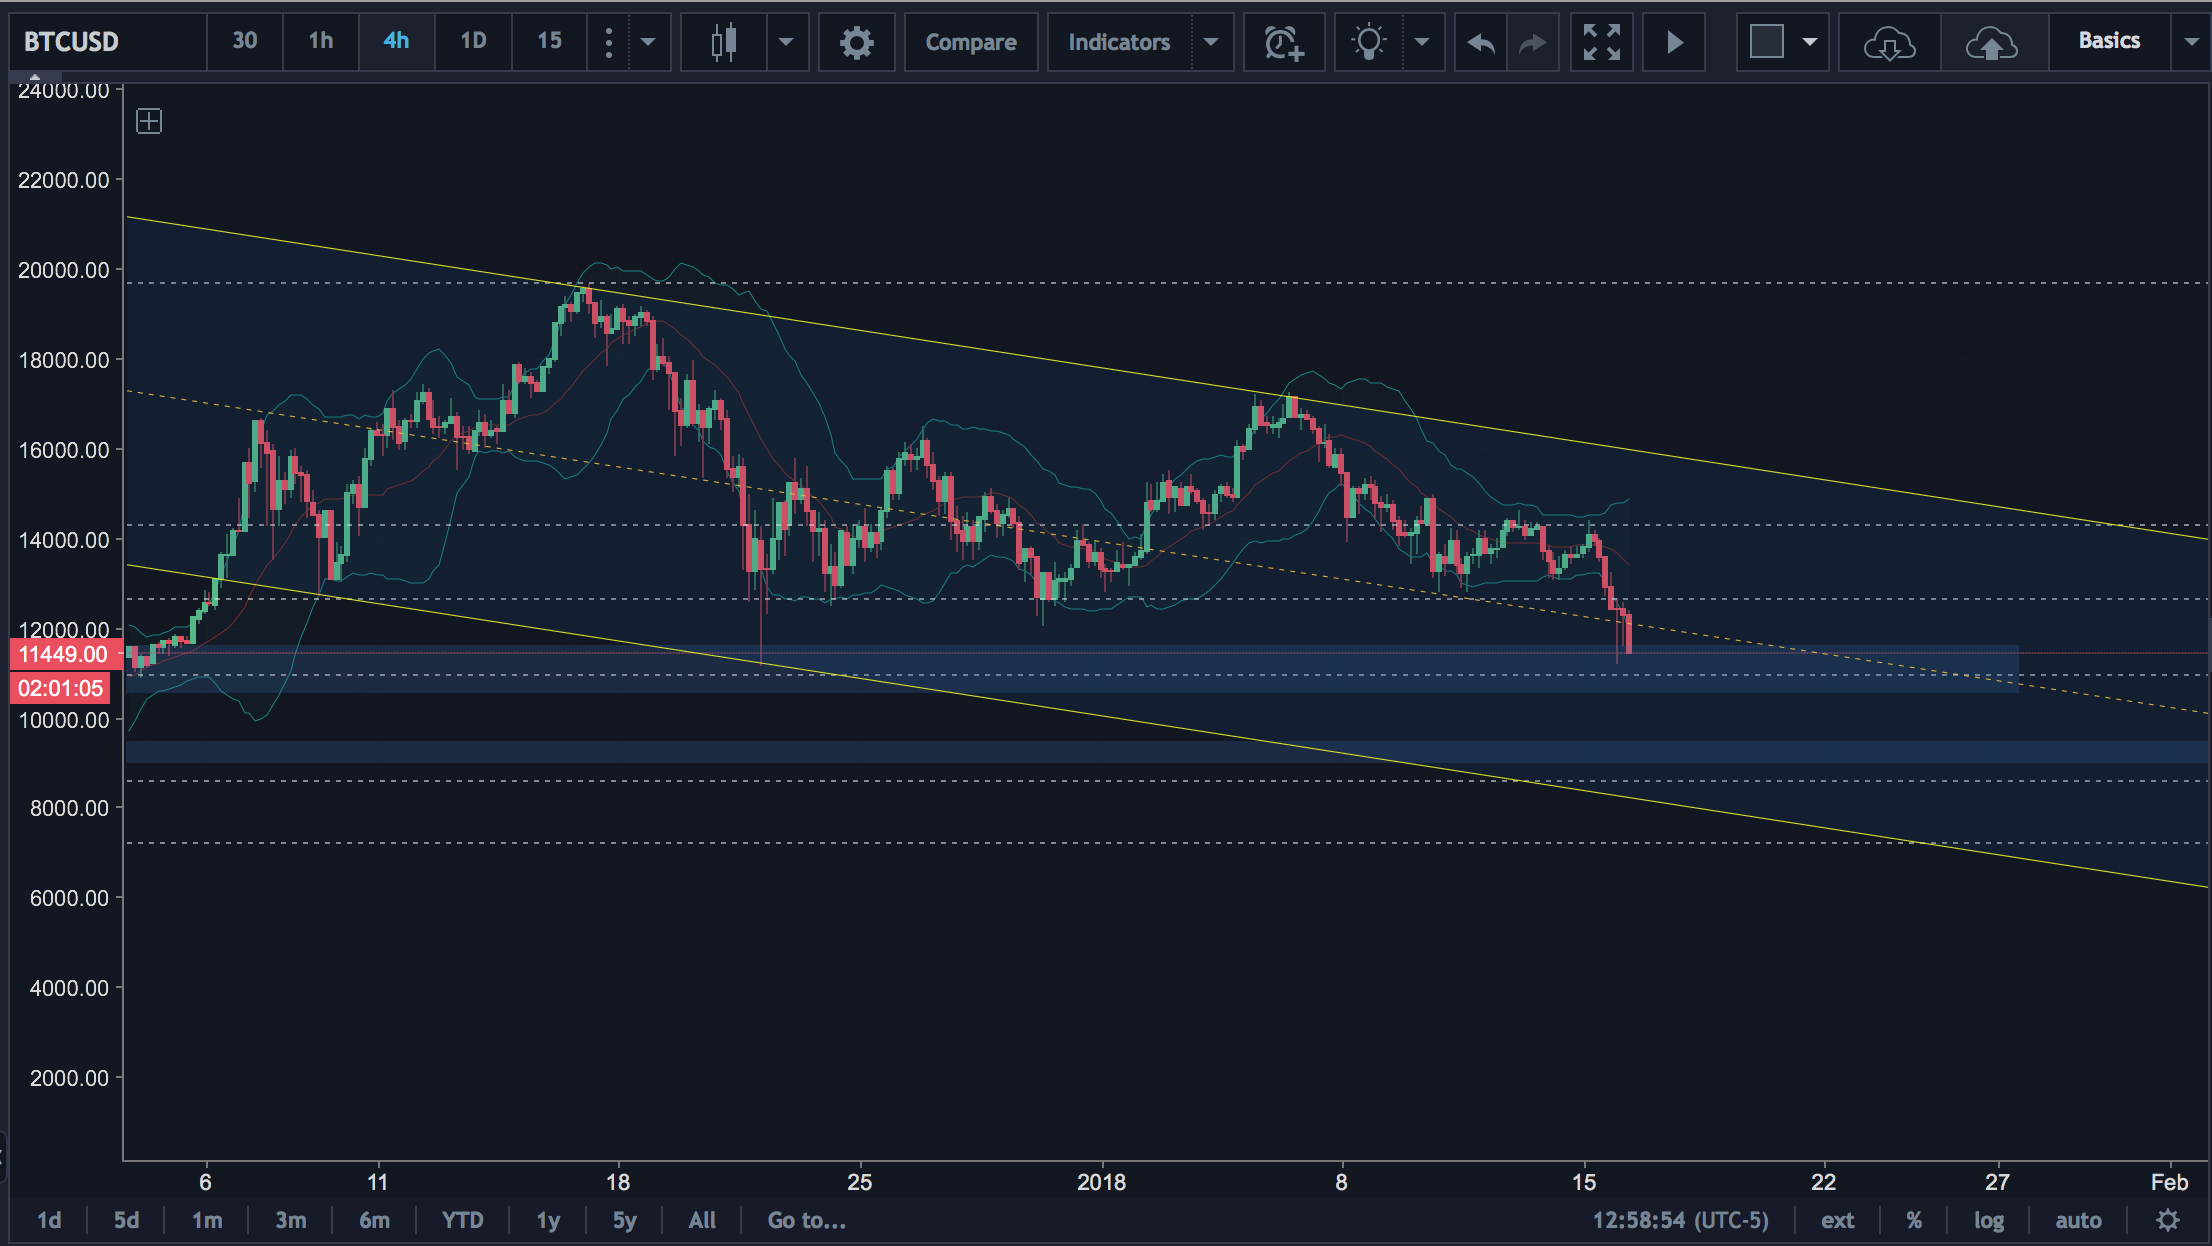
The single most important thing I want to highlight about the current situation on this BTC/USD chart is the demand zone we are toying with now. This zone has held its demand since mid December on it's first touch to it. The zone ranges from the $10,492 price level to $11,730; it can be argued there is either another minor zone at $12,500 level or you can include it in the larger range.
Another key technical I want to point out is the downward trending channel we are in high lighted by the Yellow lines. Whether we test the bottom of this channel one last time will remain to be seen, and I am expecting to try; pending we break this demand zone we are in. But the more notable thing about this channel is to watch for breaks above it in the coming days of demand. It is our reference point for a bullish continuation.
A technical indicator that I use less often, but still on the chart is our fibonacci retracement levels. If you know how I trade, you know I'm a fan of extensions more so than retracements, but I know it serves as a good judgement for many new traders.
The demand zone we are currently at is resting on the 61.8 fib; a common buying place for many retail and day traders. We are seeing some minor demand come in here, but no real bullish reaction as of yet. It does continue to serve as a level to watch however.
The "confluence" zone of this chart does happen below $10,000. Confluence is when multiple technical indicators line up to give a "buy" or "sell" signal. On this chart we would be looking towards the prices around $9,000. This is where the 78.6 fib lies, the bottom of the descending channel and yet another structurally strong demand zone. That and with the psychological factor of under $10,000 being "cheap" could really drive prices to recover, if not overwhelmed by "fear".
Again, this technical outlook is made to showcase potential supply and demand zones and is not meant to be taken as financial advice or recommendations. It is simply for your own research and awareness.
See you guys on the next major market move.