Daily Crypto - 1/31/18 - No good news for the BTC/USD chart. Bitcoin headed to $6,000.
Wish I had better news this morning but I'm seeing no improvement in the BTC weekly chart. $6,000 is still the projection.
Hint: Right click on the chart and click "View Image" for a full size image.
The high volume and fast accumulations (purchases) of BTC has lead to a classic bubble. Greater volume is often associated with good news or an event, but even when there is good news an asset needs to rise at a pace that allows constant and steady accumulation (buys that slightly outweigh the sells) or there will be a sudden breakdown of price (the bubble breaks).
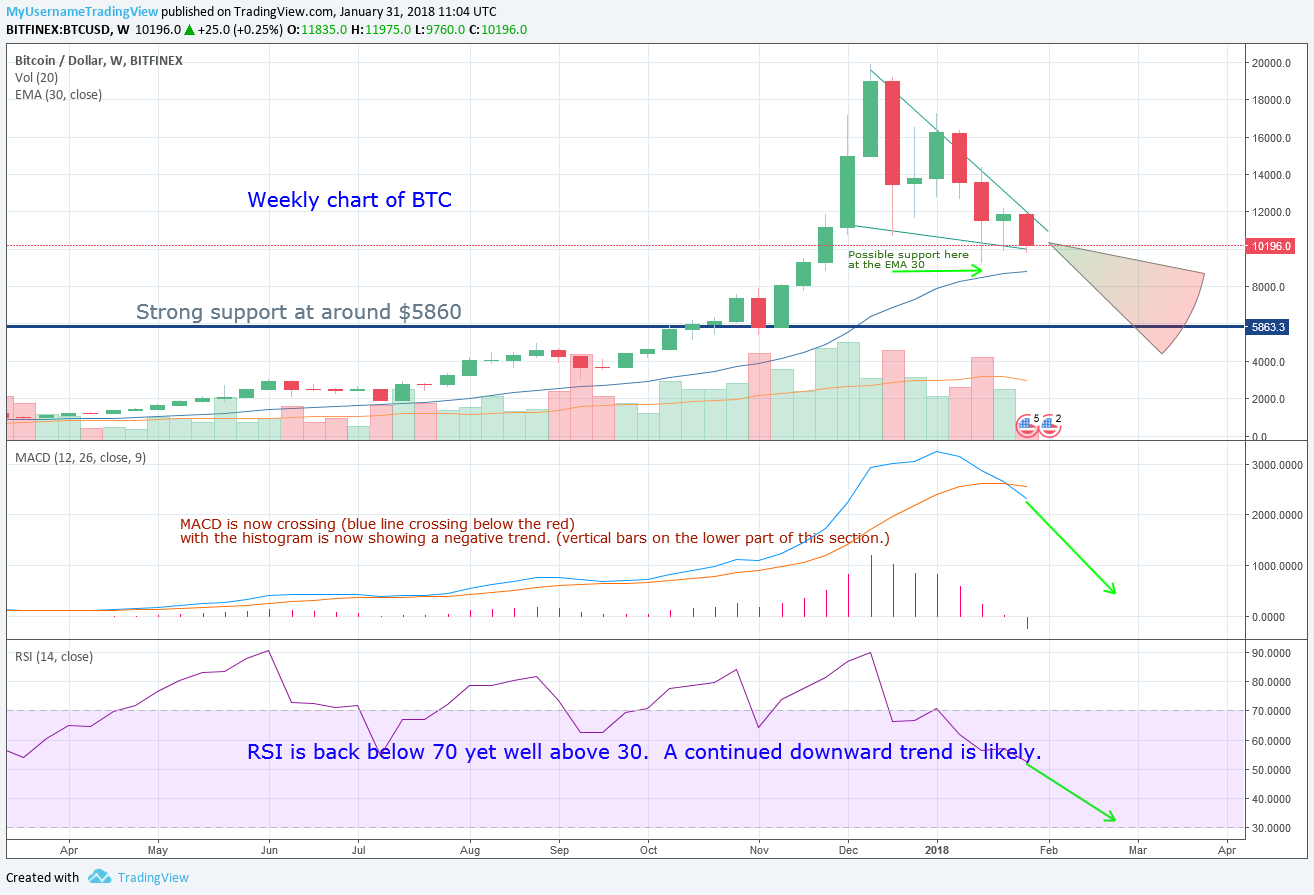
The lower blue lower line (that curves upward with a bend) on the top chart is the EMA 30 (Exponential Moving Average). This is an indicator that averages out the price based on a number of price points. We are using the EMA 30, based on each days closing price. It looks like we may get some support on the EMA 30 at around $9,000, or if BTC can hold steady at $10K, we may find continued support. If BTC where rising at a steady rate over a course of 30 days, it would rise perfectly in conjunction with the EMA 30 line. However, BTC has been trading much higher than the EMA 30, which means it is at risk of a correction (price drop), as the average price over the 30 days is much lower and it will need to slow down somewhat. It is very possible the price will drop way back down to the solid blue horizontal line (my support line at $5850), before it finds stability and begins to rise again.
The classic wedge pattern is clearly visible. When these two lines meet, there is often a sudden move up or down in price. We will need to watch this area carefully.
The MACD (Moving Average Convergence Divergence), portion of the chart (middle area) is now indicating a full blown reversal as the blue line crosses downward below the red. Ideally, the blue line would be slightly above the red line with some mild cycling back and forth.
Lastly the RSI (Relative strength indicator) on the bottom 3rd of the chart is showing a value below 70 now but until this correction is complete an RSI of 30 or so is very likely. When the RSI rises much above 70, then it is generally considered to be overbought and will likely correct back to a figure between 30 and 50.
My projection for BTC is shown in the painted (light blue to red) downward pie wedge.
Hope this analysis is useful to you. Comments are very welcome.
Disclaimer -- I hold ZERO positions in BTC.
Invest wisely for the future.
I've been trading now for nearly 40 years, but this is just my personal opinion and should not be taken as financial advise!
https://ColemanAir.us
Craig

Thanks for the post and the analysis, Craig.
It's just on sale! :)
Yes indeed all the way down to $6,000.
Been predicting this drop since my first post 50 days back. Everyone pretty much believed the on sale meme then too. It's really hard to accept that a bubble is collapsing. We'll see if it can hold here.
Hope everyone looks carefully at the better coins for a long term investment.
Good to hear from you again!
Craig
I think BTC is going down a lot too. I sold my BTC last week, because I expected something like this. Your post is great, thanks for sharing your opinion!
Thank you for the comment.
I think you did the right thing. If not you can always get back in when it shows the right signs again.
I'll try to keep my followers updated.
sometime even i m thinking like wasting time in monitoring the bitcoin price.. still could nt stop..
Pretty addictive isn't it.
Thanks for commenting!
yessss....
thanks for sharing your opinion bro :)
Thanks for the thank you!
Hope the information is useful.