Bitcoin (BTC/USD) - Technical Analysis Update - Some Bad, But, Bitcoin is Still Looking Up - (07/27/2018)
Technical Analysis for Bitcoin (BTC/USD)
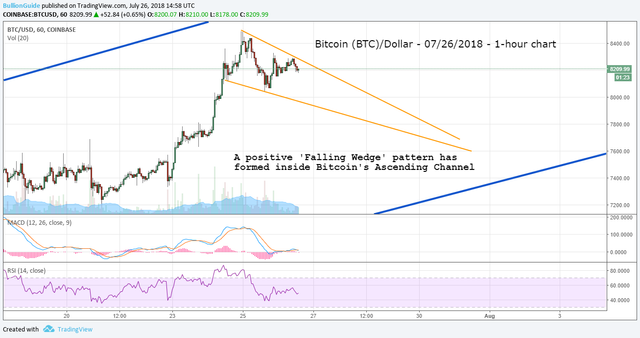
Yesterday, I wrote this post for Bitcoin.
The chart below was the last chart that was in that post.
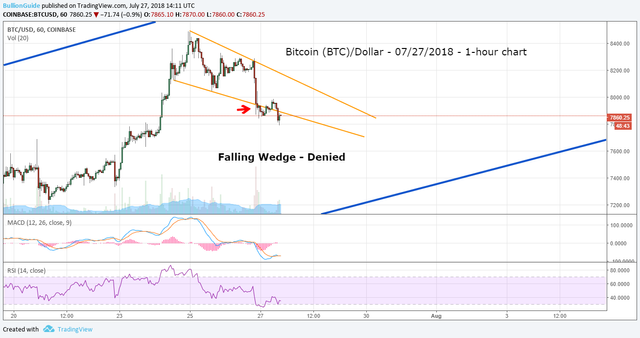
However, after the Winkevoss's ETF was rejected by the SEC the price of Bitcoin (BTC/USD) fell, denying the positive 'Falling Wedge.'
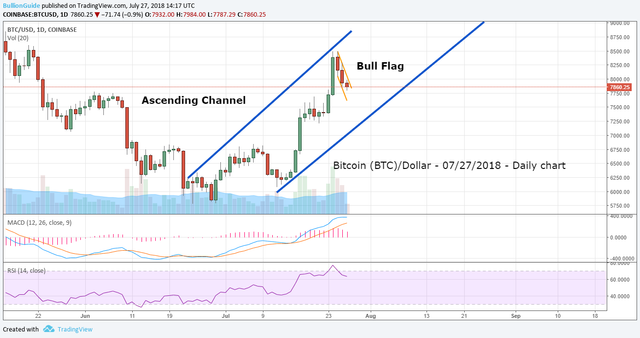
This morning in preparation for this post, I've reverted back to the Daily Chart to show you that the positive 'Ascending Channel' is still intact in Bitcoin's chart.
Furthermore, when looking at the Daily Chart, the new positive pattern that has formed in Bitcoin's chart is a 'Bull Flag,' so Bitcoin (BTC/USD) is expected to continue its upward movement, despite its fall yesterday.
Disclaimer: This is not financial advice.
The Charts provided courtesy of TradingView.com
Normally, I write about Gold Nanoparticle Cancer Research and I do technical analysis for silver, gold, and the U.S. dollar, but I'm also a fan of cryptocurrencies, and because of this, I've started to share my charts on the coins and tokens I own or follow.
My website is called: The Free Bullion Investment Guide, it offers anyone interested in the precious metals bullion markets an honest place on the web that provides bullion market reference material, bullion market news, and other market-related information. http://www.free-bullion-investment-guide.com/
Lastly, the bullion guide supports and sponsor's Gold Nanoparticle Cancer Research, half of every dollar it earns goes to this research through The Angel of Healing Cancer Research Fund. (This includes the money earned through steemit)
Thank you for your time and God Bless,
Steve Warrenfeltz


