Bitcoin's on the move, STEEM rally continues on rising volume and EOS keeps finding a bid
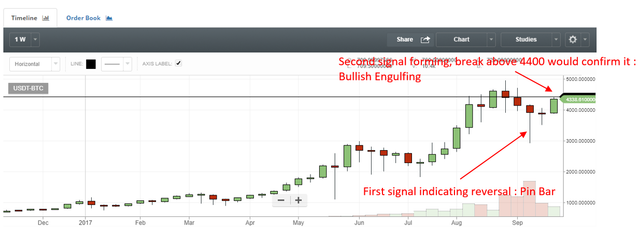
BTCUSD has breached the rising wedge top and bulls will be looking to propel the pair higher to 4400. A break above 4400 would target the next resistance zone at 4600-4700:
STEEMBTC put in another massive, high-volume up day on Friday this is a very good sign. Pair is currently down on the day and this could be a great buying opportunity if you are like me and think we've seen a paradigm shift:
EOSUSD continues to find a bid despite a head and shoulders pattern on the hourly and I'm looking for a break out of the triangle over the coming sessions. A breach of the head and shoulders neckline would invalidate my immediate bullish bias and cause me to thin out of my margin long:
This post was brought to you by @msp-creativebot
I wonder if Steem's good run is connected to the buzz surrounding @ned 's announcement about Smart Media Tokens. I think it is. YouTube has caught the news last night and Steem is now being viewed as the new Ethereum.
Japan has allowed operation of 11 bitcoin exchanges as per the news. Japan's positive treatment is cancelling the Chinese FUD slowly and we can see the price rising.
What do you think?
Yeah it most definitely is see my post from 2 days ago I was up at 4am struggling to write about it as the price rallied lol
Timing was great from technical perspective too though, the consolidation was getting very tight.
and yep agree completely about sentiment rebound!
Steem has been travelling between 1 and 2 dollars last few weeks. Wonder if this news will
Actually price hasn't traded >= $2 since June 26:
Wow time flies :) What I meant is that it has been very volatile between certain boundaries since that spike. I wonder if this occasion will be different...
Nice, i like this, naked chart with support and resistance & chart pattern...
Would be good if candlestick pattern are used also to confirm trend..
Yes looks bullish, if break 4400, then bullish engulfing have been made, then we would see the rally to 5k resistance level...
Lets follow each other to share trade ideas.. thanks
Hi mate, I tend to use candlestick patterns, chart patterns, trend-lines, support and resistance zones and Fibonacci extensions - they are my favourite tools :)
Re: bullish engulfing candle - these have to occur at bottoms or swing lows. A bullish engulfing candle is a bullish reversal candle that occurs at the end of a down trend:
Thanks for the reply.. That is great to hear on the tools that you used... that is my favorites also, with fibo retract on addition.. i use weekly chart to spot trend... and then trade follow the trend on short term..
After 4400 break btc/usd looks bullish to me.. :)
I got you now! You were talking about a bullish engulfing on the weekly - apologies for trying to school you :)
No worries, I was in forex trading for 10 years, and now into crypto trading.. Still have to learn more
More easier to score on crypto trading vs forex trading.. since size of bid/ask is know in the exchanges in crypto as transparent..
Good luck on your trading.. :)
Great analysis.Thank you for giving us an idea if we are going to sell or hold. I''ll give you my upvote and resteem :)
Thanks kizza :)
Thanks for your nice posting.
Upvoted. I'll be resteeming this now :)
Thanks Taylor :)
Wow. I pray steem moves up too.
this is really nice from you i like it
Yay! You're back in the TA tag. And on the dole again. Good work.
On the dole again, ohhh I just can't wait to get on the dole again ...
Following