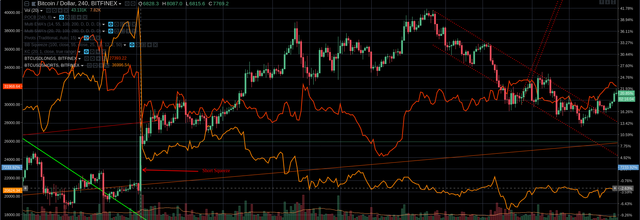
Bitcoin reversal structure invalidated ... anyone else getting rekt out here?
In yesterday's piece I wrote that I was looking for a bounce from above trend-line support and still expected the next major development to be a return to 10K ...
... Boy did I get that wrong. Bulls got some brief respite shortly after my post, but these gains were quickly wiped out as sellers came back in full force, not only taking out the trend-line, but actually breaching my invalidation point:
Now this could always be a false signal: a wash out of longs before a rally. After all, the 61.8 still holds ... but from a purely technical perspective, we are looking at lower highs and lower lows and I see significant risk of further downside over the coming sessions. Hopefully I'm still out of sync with the market.


The market is in a crash pattern. Look at how volumes decline with rising price - it's apparent on 12h.
Also, despite the way it's dumping, the number of shorts on Bitfinex is decreasing while the number of longs rises. In other words, there's plenty of rocket fuel for a dump if the longs get squeezed. I wouldn't count on seeing a proper bounce without a spike in the number of shorts first.
The margin markets are a pretty small part of things to my surprise. Lending rates don't seem to lead price at all, they lag: the past three cases of rising yields at finex came well after price rallied.
I was looking at the squeeze hypothesis a little while ago (both in isolation and from a net long/short perspective) and without going too in depth, seemed about as reliable as any indicator (a little better than 50/50 maybe).
Sure, shorts, longs getting squeezed always helps, but the margin market is very small compared to the spot market and doesn't appear to be a huge driver. I'd like to see an open interest indicator for finex (spot and margin) - I think that would be very useful indeed.
Also institutional were still net short last COT report - that market is still incredibly small, but might provide some cues as to when the big institutional buyers are actually coming to town.
I don't pay close attention to the lending rates, just the number of open longs and shorts. Violent reversal green candles like the one on 4H April 12th 0800 UTC are definitely the product of short squeezes.

The recent trend in drop in price corresponding with a decrease in both shorts and longs is indicative of money leaving the ecosystem (or moving to the sidelines to wait for bottom) There isn't enough new money flowing in right now. I think we will see 5k before 10k...
I think it's important to get cause and effect in the right order here - you can't have a short squeeze with out price rallying first ie price rallying triggers margin calls on short positions. This then adds to pre-existing buying pressure.
Remember, people getting squeezed are, for arguments sake, "dumb money". Initial reversals are caused by "smart money":
The dumb/smart classification is of course an over simplification as some of the people getting squeezed are being trailed rather than liquidated etc.
Regardless, the "dumb" traders are on the wrong side of the market and the "smart" traders are correct. The smart traders cause the rally, the dumb traders are affected by it (and then affect it indirectly, reinforcing existing momentum as their positions are liquidated/covered).
This is a useful tool...
Our charts look the same! Thanks for the update, I added you to favorites, I'll be checking back.
#rekt
Thanks for sharing updates lets see how things go and what would be the the future statistics.
Condolences. I was expecting a rally this week too. Got the last of my dry powder ready to go but now I'm waiting for a decent low. Maybe this weekend.