Bitcoin Breakdown
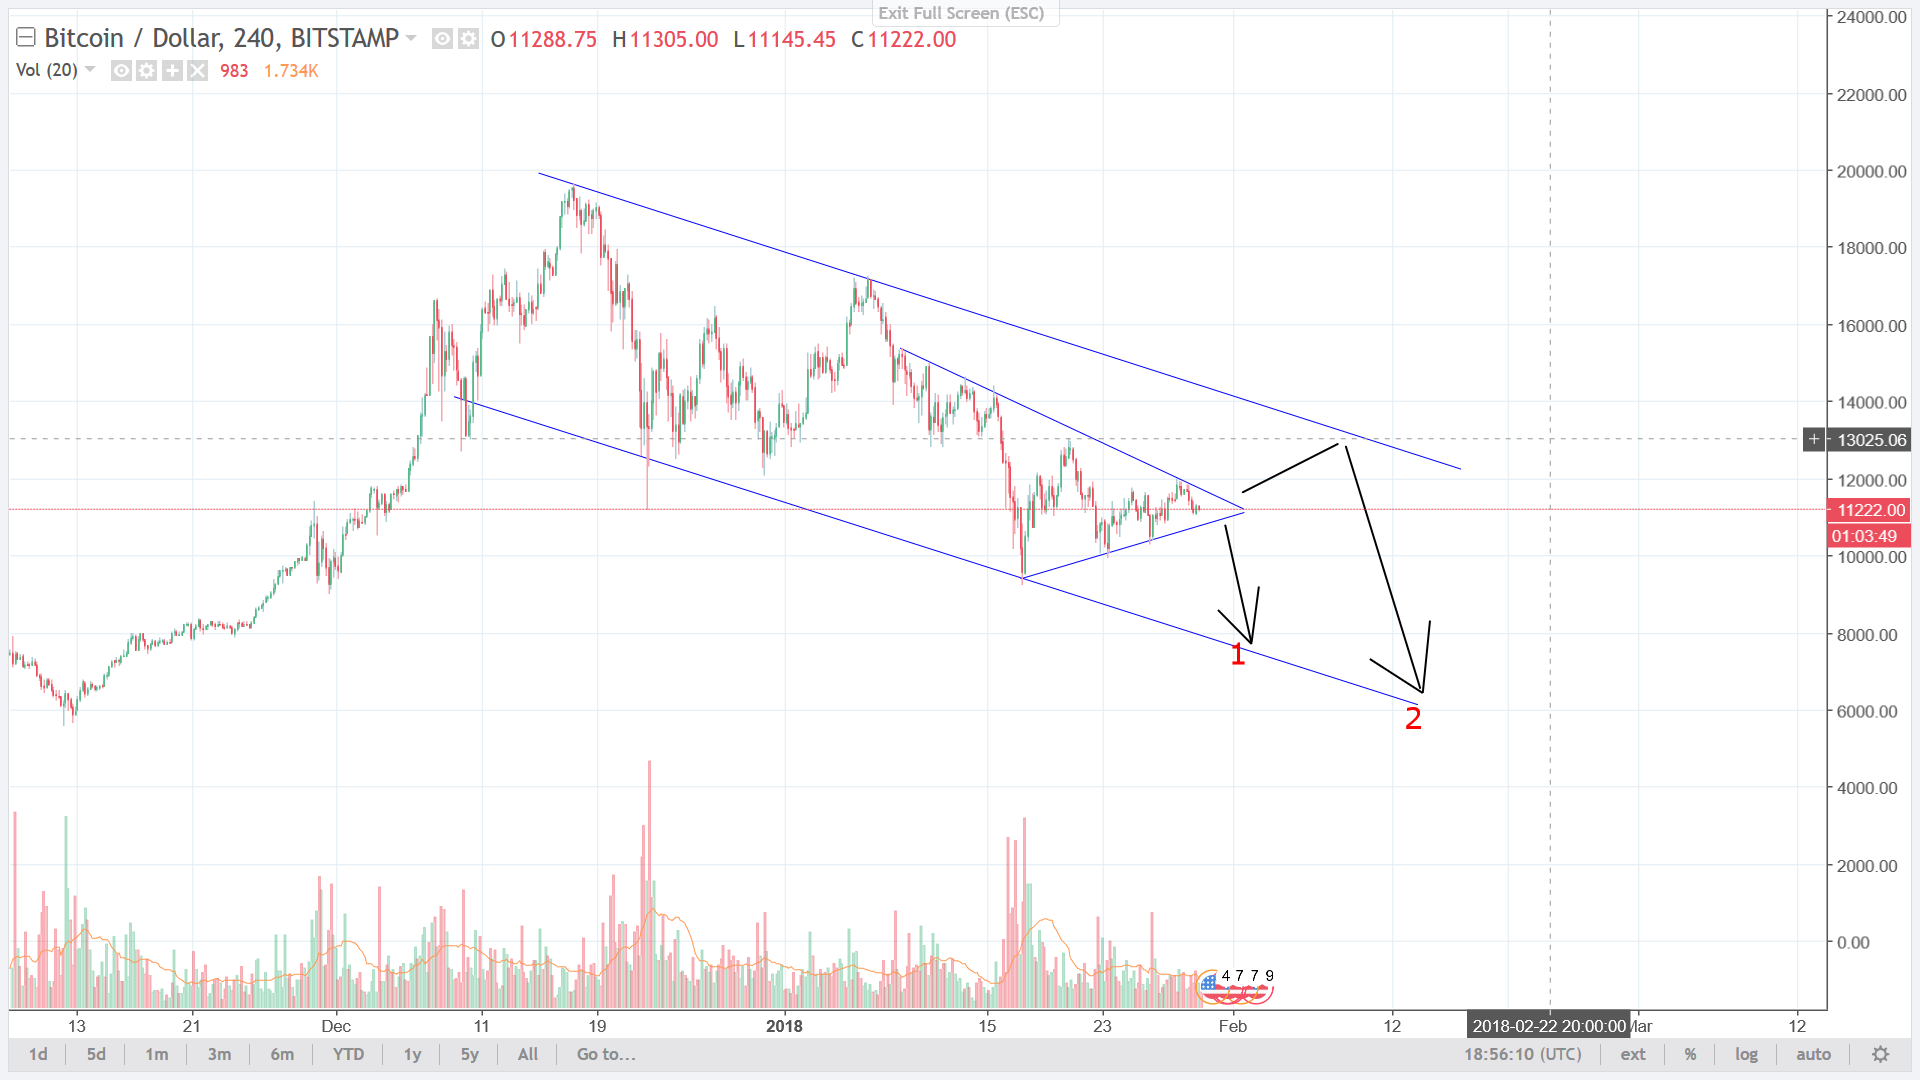
Yesterday I showed that Bitcoin was in a descending triangle with two possible moves.
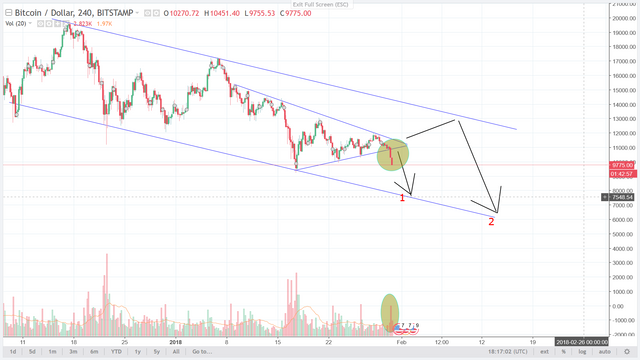
A few hours ago Bitcoin broke down from this pattern and IMO is heading for another lower low. I highlighted the volume confirmation of the breakdown.
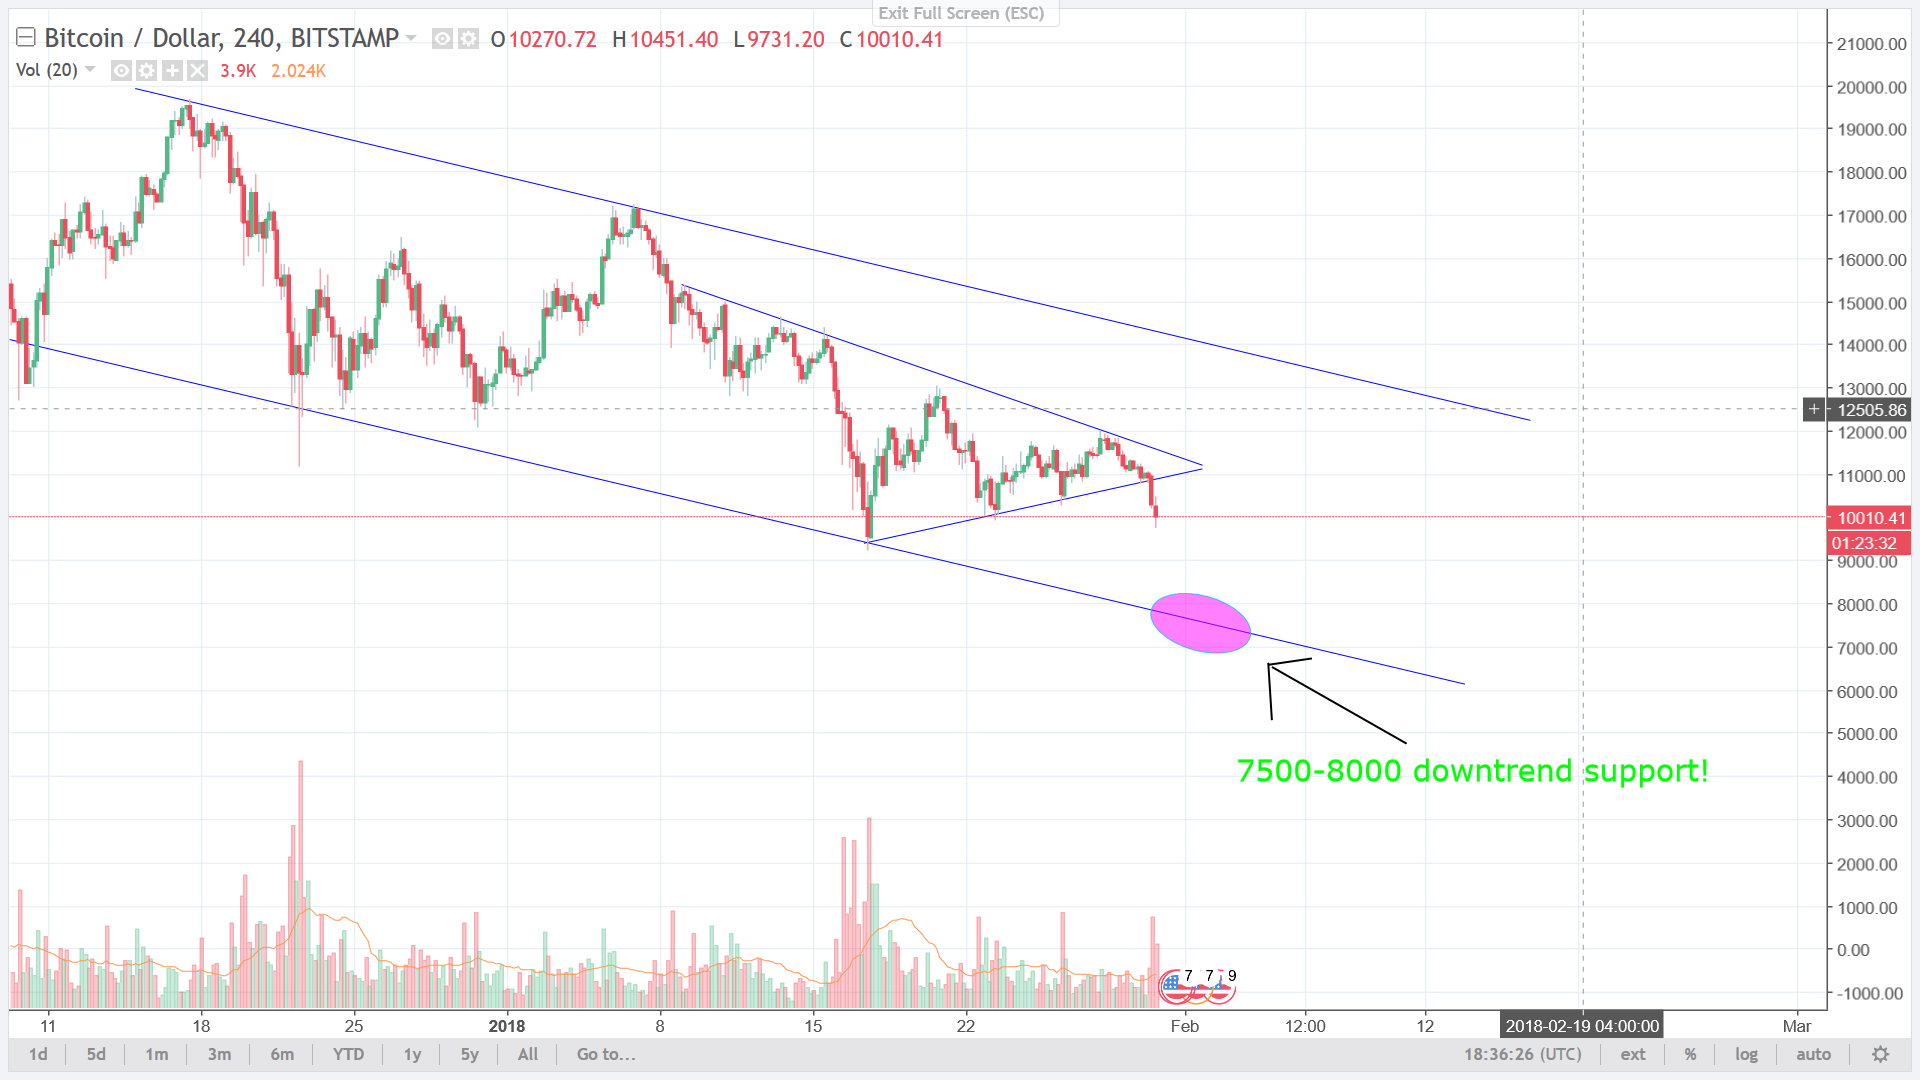
I would expect to see some slight support at the last low (9500) area before we break down to the 7500-8000 level. This level indicates the lower trend line support for the downtrend. Keep in mind that the longer it takes for Bitcoin to hit that lower downtrend support, the lower it may go!
A lot of opinions out there saying this is the last low of the correction and could see a trend change from here!
Trade accordingly and we'll see! Keep a close eye!


.png)
Do you know why the cryptocurrency market always crashes down at the beginning of the year? I just checked the chart and I say that it seriously happens ever year....
I have read a few things about why it crashes. I think that its a correction that's just about over.
Yea, I think we went extra low because of the FUD.
How high can it go after this dip?
Great question!
Is there a "Great Answer"?
It can go as high as the next person is willing to pay for it! That's what I always say.
Thanks for that Dodgy answer, lol. what price do you speculate we will see on this next surge?
I could see BTC doubling from its ATH sometime in 2018.
That is the answer I wanted to hear.
this comment thread is a descending triangle too