BTC TA (Technical Analysis) - ANALYSTS DAILY SUMMARY - JUNE, 6th

JD Marshall
Primary argument that BTC is consolodating at these levels and building steam for higher highs in the FUTURE is still his macro perspective. In his opinion we're not seeing BTC reaching all time high any time soon. BTC next big resistance is the top of $9990.
Since Feb. BTC's seen 3 major bottoms around the 6k-7k level. Which is an indication of forming higher lows and confirms a macro bullish trend (Green Line on Chart).
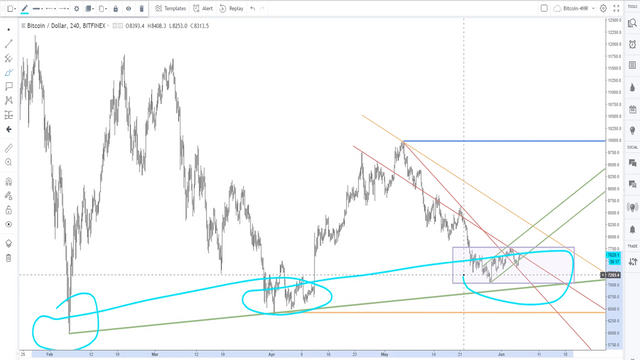
Recent selling pressure (red and orange line) is showing that BTC heading down in the short term, but in the big picture run the bulls are still in control.
All in all BTC is bullish, but will not see major moves in the short term. He's expecting more horizontal movement with BTC achieving higher prices over months. The old highs will probably be seen again in 2019.
@chartguys
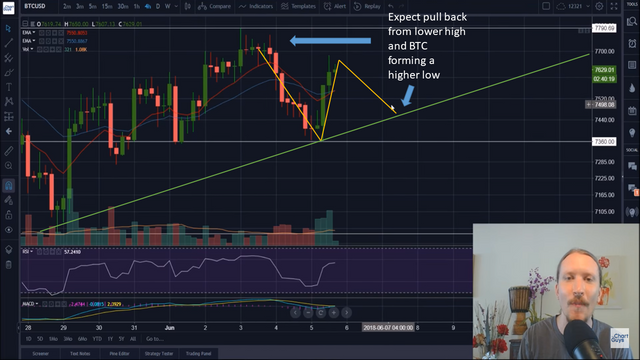
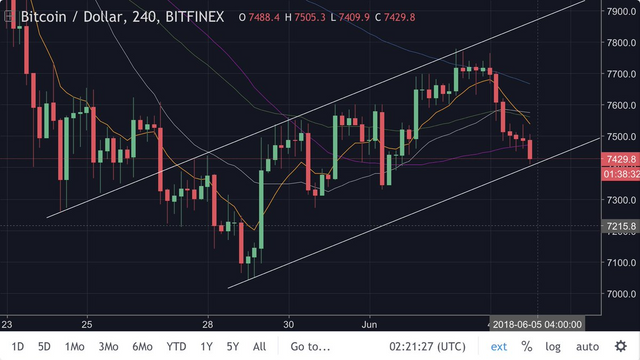
The bulls won some ground after recent pull back. On the four-hour chart the higher low seems to be in place,
On the 4-hour the coming pattern he's anticipating is an lower high, under $7791, and then a HIGHER LOW above $7360. For him this is the most likely way it will play out. Another option might be a bullish continuation, but he also mentions the least likely scenario would be to break the $7360 level, forming a lower low. He believes this is not very likely as the recent rally was accompanied by healthy bullish volume.
The Moon
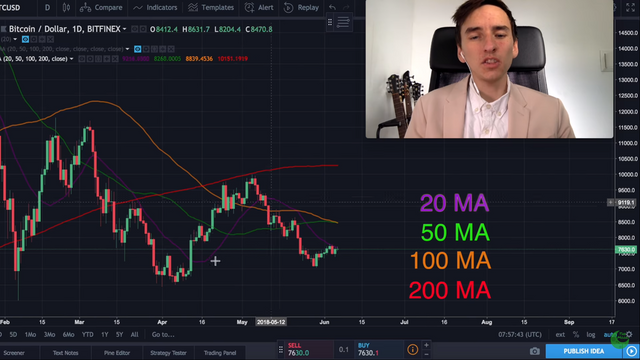
The 20 day moving average is proving to be resistance. In the past months BTC has broken through the 20 day MA, but without sufficient force to maintain a trend above the 20 day MA. BTC needs to break the 20 day MA with conviction in the short term, otherwise we might see lower BTC prices. So in short watch the 20 day MA to confirm a bullish rally in play. Although The Moon is bullish, but he's expecting to see some sideways movements in BTC in the near term.
Coin Mastery (NO NEW UPDATE)
Still waiting for a clear signal in which direction the market is going.
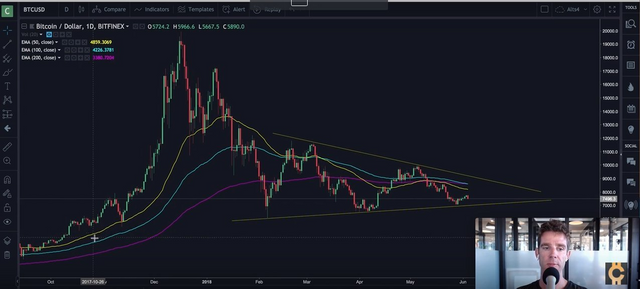
We've seen a big drop-off in the last 24 hours. The macro chart seems to indicate that BTC will break the pennant formation to the down side. Statistically he does not see BTC making any major moves to the downside or upside. He anticipates a slow grind for a while and some sideways trading.
All the EMA's are converging (see chart below), which is an indicator that big moves won't happen.
@tradedevil (NO NEW UPDATE)
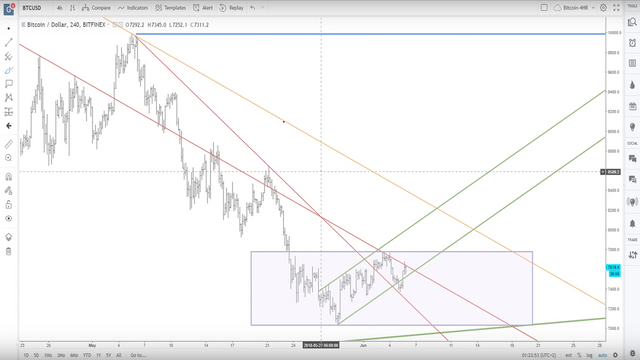
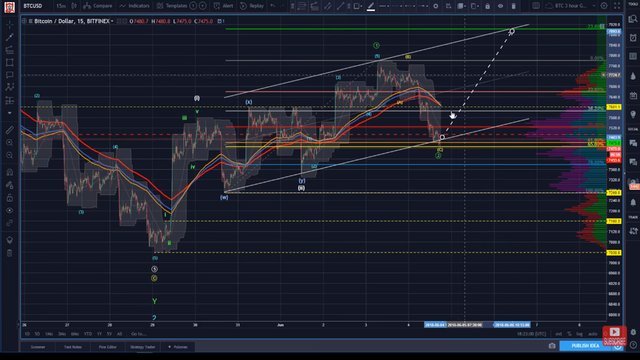
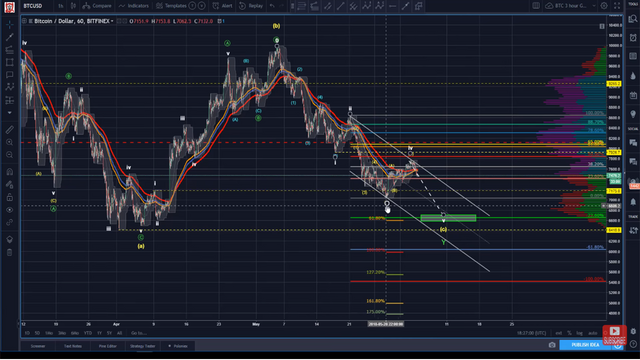
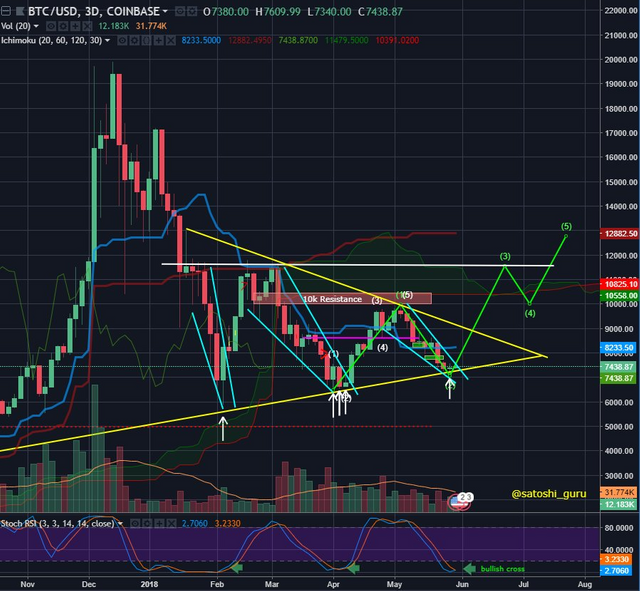
BTC Primary count: BTC finished a second wave with the recent low at $7000. This is still his primary count, with his bullish bias. However, if BTC falls below the $7000 level that leg down cannot be the second wave, and he'll have to re-asses.
Using the Fib. Retracement Tool from swing low to swing high, BTC has some serious support around the golden zone ($7474) and this should lead to a push much higher around the $7893 level. If we do not see a major move up from the $7474 level with higher buying volume the count would have to be revisited.
Elliot Wave aside, from swing low to swing high BTC is a buy at the $7474 level and has a 9 to 1, risk to reward ratio, which is a very safe trade.
Secondary Bearish Count:
Bitcoin is in a ABC pattern, and currently busy finishing the C leg down. For this count his buy zone is around the $6600 level.
chris L $ChartVampire$
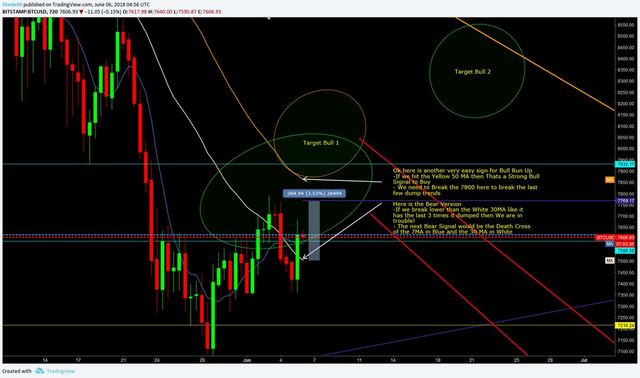
Chris posted the following warning relating to BTC's chart (See chart below for more in depth detail).
Warning ⚠️⚠️⚠️⚠️⚠️ this is a very dangerous trading in this range it is best to wait for the breakout of the 50 MA on the up side or the 30 MA on the downside to trade safely.
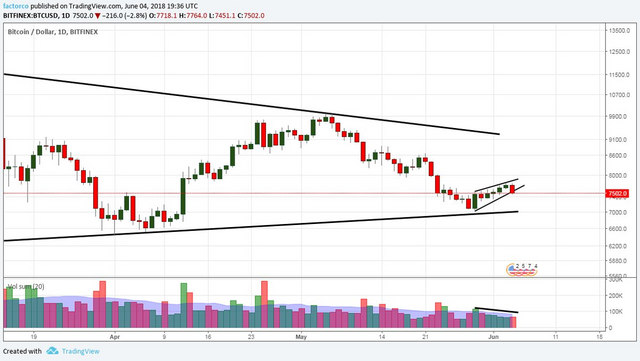
Peter Brandt (NO NEW UPDATE)
The lack of buying enthusiasm during the recent 6 day rally (composite of multiple exchanges) plus the increased volume on today's decline puts near term outlook into doubt. The big symmetrical triangle remains the dominant chart construction.
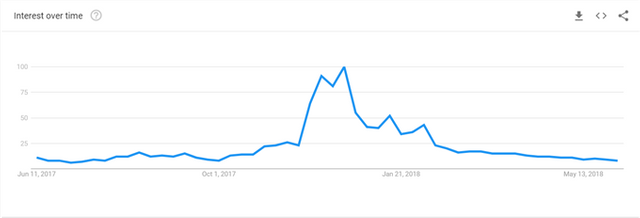
Nick Cawley (NEW FUNDAMENTALS ANALYSIS)
A look at Google analytics show that searches for Bitcoin (BTC), Ether (ETH), Ripple (XRP) and a range of other cryptocurrencies have fallen dramatically after the market slumped at the start of the 2018. While investor interest has fallen, the number of net-long retail customers remains near to all-time high levels, suggesting investors continue to hold positions despite lower prices. The Google trend data may suggest that investors looking for quick returns have moved on and that going forward the market will continue to mature. Recent trading ranges give credence to this with support levels holding, allowing the market to push gently higher.
GOOGLE TRENDS - BITCOIN
Trading Room
BTC is approaching support, if this line holds, another bounce attempt to 7800, if broken next target 7100 area. Expect slower grind & absolutely boring price action until break below 6900 or break above 8993
Crypto Guru (NO NEW UPDATE)
Mini Falling Wedge (teal) within a Massive Wedge (yellow). We faced the same exact situation at the start of Feb & April; except this time he believe we're ready to break through the Massive Yellow Wedge.
Coindesk Markets
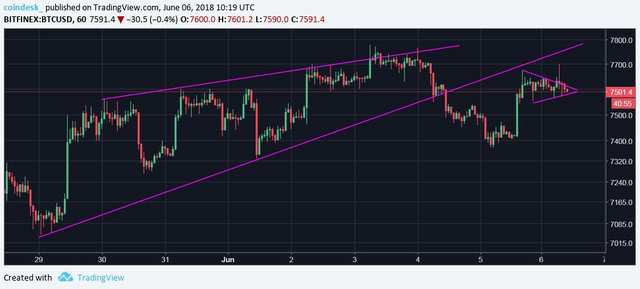
BTC'S hourly chart shows a pennant pattern. An upside breakout was seen at 06:00 UTC but failed to yield a rally.
Now BTC is eyeing a downside break. If confirmed, BTC could revisit $7,372
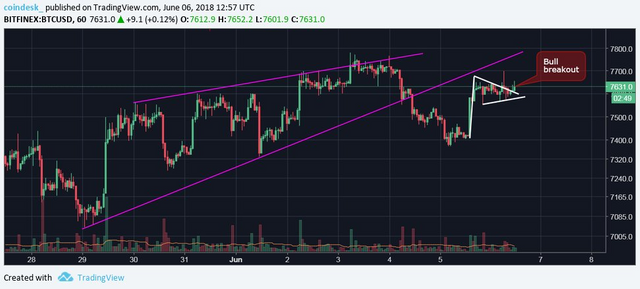
BTC's hourly chart also shows a low volume bull pennant breakout - it is a bullish continuation pattern but the upside is struggling to gather traction...
Also, a shout out to @famunger for his daily Analyst Summaries.