BTC TA - Bitcoin Technical Analysis. Analysts Opinions JUNE, 1st
BTC TA ANALYSTS DAILY SUMMARY - JUNE, 1st

Analysts Sentiment Summary
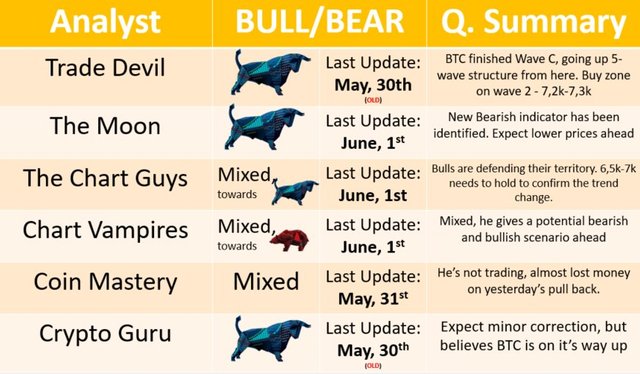
JD Marshall (20 hours old)
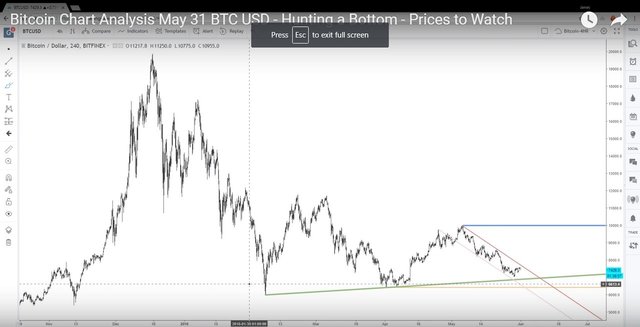
MACRO CONTEXT: BTC Market flattened out nicely after 2017 all time highs. Market is trading at much more normal/realistic levels and is slowly building energy for the next push higher.
TA: BTC's recent pull-back is not negating the bigger bullish trend change. As long as BTC stays above the $6900 area the macro trend line remains bullish. If BTC is able to break the short term downward channel, he's expecting another type of 'dome/arch move' (in the long run). Very important that BTC remains above the green uptrend line (see chart).
If BTC breaks the downward channel above $7700 we'll see higher prices in the future. However, he does not expect BTC to break the previous high of $9900, as markets are flattening out in his opinion. If BTC breaks $9900 it would be a very bullish indicator and the start of a new bull market for the long run.
@chartguys
Macro Context: BTC need higher low and higher high to confirm a macro trend change on the weekly time frame.
On the four hour chart we've had a recent pull back, but it's still a technical 'higher low'. The bull's are able to defend their territory. The 6.5k to 7k area needs to hold, for the 'trend change' to be confirmed.
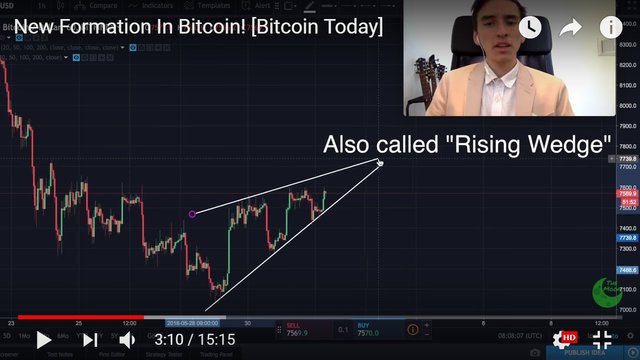
The Moon
Bitcoin reversal from the triple bottom (from the pennant formation) is a good sign. However, on the one-hour chart he has identified an ascending wedge which is a bearish pattern, which might indicating lower prices in the short term. An ascending wedge can either be an indication of a bearish trend continuation or reversal from a recent bullish run. In the current situation it would indicate a continuation. Also, the ascending wedge is converging with the recent resistance level of $7600.
Coin Mastery
Recent "Bart Simpson" tendency in Bitcoin, where price shoots up and down, is a clear indication of algo-trading. He is of opinion that the macro trend is upwards though. In his opinion the markets are currently high risk. He's currently in 'watch mode' and not trading. He hopes for a higher BTC price (around $8100) which would confirm an uptrend, before climbing back into the market.
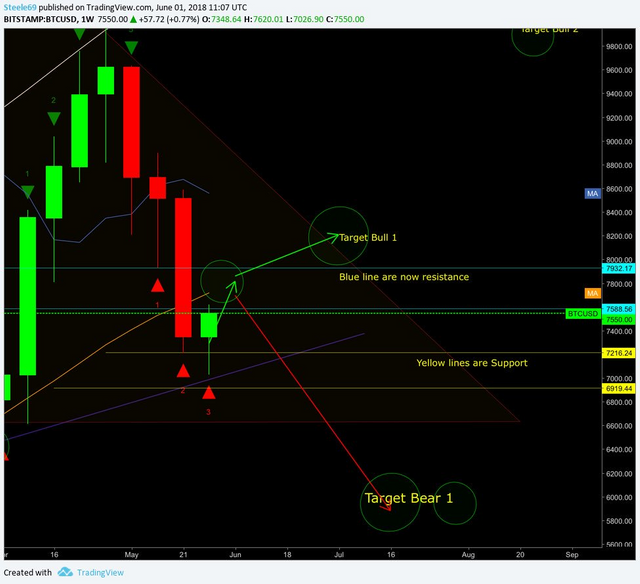
chris L $ChartVampire$
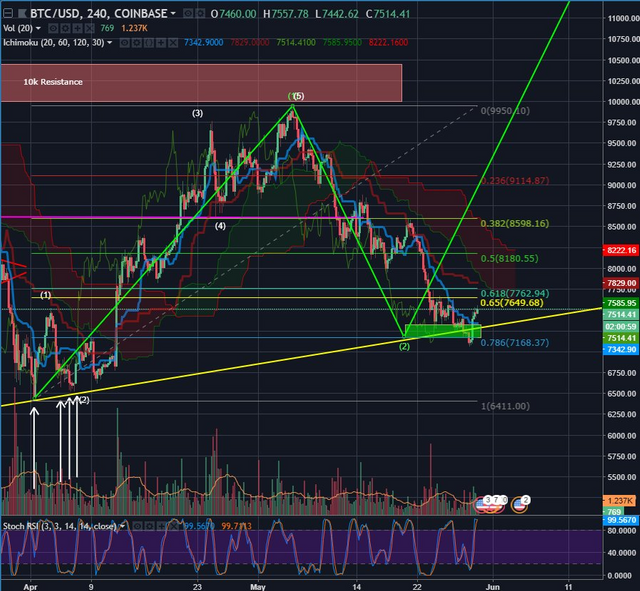
He observes that BTC has 2 resistance levels ahead - $7588 $7932. The 50 MA can be considered as the short term top, in his opinion. The chart below gives two scenarios: 1) Bullish & 2) Bearish. The Chart is self explanatory.
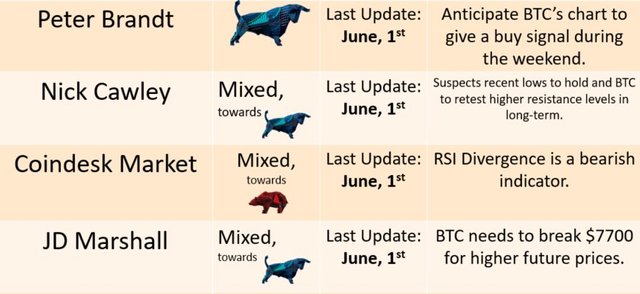
Peter Brandt
That said, he also notes that the trading volume has been diminishing since February. He notes the following regarding volume: " $BTC since 6Feb low, especially volume contractions at three intermediate lows. Sign of supply drying up, but we still need a WBB day up on expanded volume to gain some confidence"
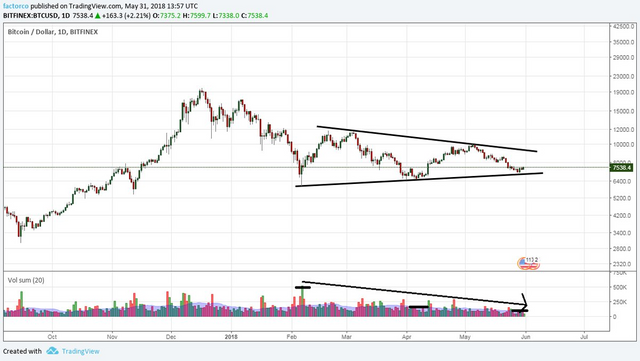
Peter's anticipating a chart buy signal to appear during the weekend. As of writing he has not given a buy signal yet.
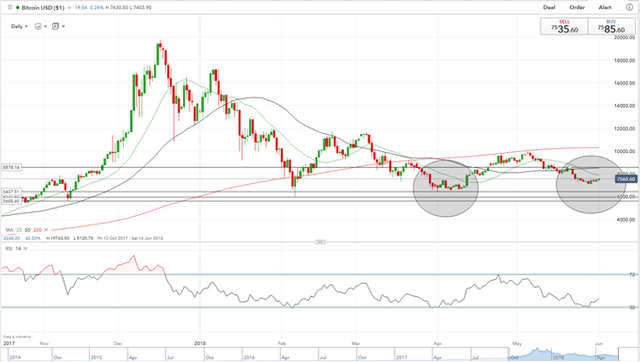
Nick Cawley
The largest cryptocurrency ends the week marginally higher and is currently building a base for a potential move higher, while the RSI indicator sees BTC bouncing back from oversold territory. BTC has good support between $5603 and $6438 and is unlikely to threaten support in the short-term – all things being equal. On the upside $8578 looks a likely first target before the coin re-tests the recent the recent high just above $10,000.
Trading Room
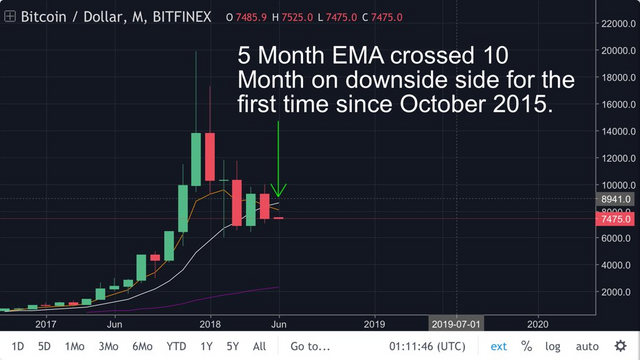
BTC's monthly candle closed today. For the first time since 2015, the 5-Month EMA crossed-over below 10-Month EMA. Bitcoin's June candle needs to close above $9000. If not, it’s one more trigger indicating further momentum coming to the downside.
@tradedevil
(NO NEW UPDATE)
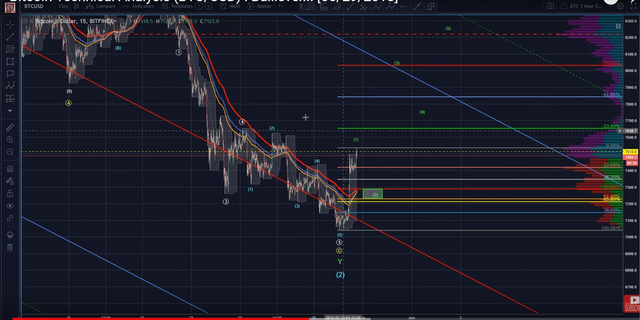
BTC just finished a 5th wave down within a 5th wave, within the larger ABC structure. Thus finishing C leg down. Therefore we're probably looking at a 5 wave structure from BTC's low, with the first wave being almost finished or already finished.
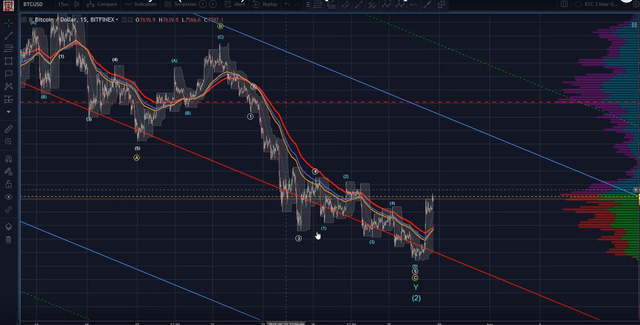
Looking to play the 2 wave coming down to capitalize on the 3rd wave going up. A potential buy zone is between 7.2k-7.3k.
Crypto Guru
(NO NEW UPDATE)
Expecting a minor correction after the recent rally. The Triple bottom, from the lower area of the pennant formation, is a very bullish sign.
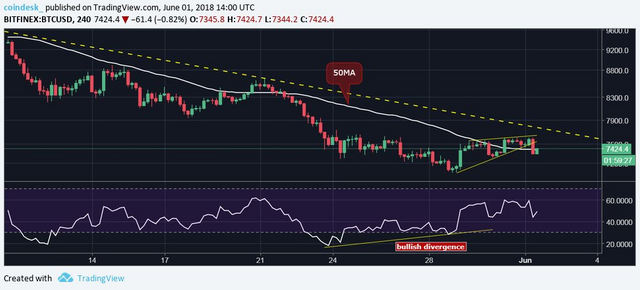
Coindesk Markets
The bullish RSI divergence has ended in a rising wedge breakdown, indicates sentiment is quite bearish.
$7K could be tested if the 4H candle fails to retake the 50MA.
Bulls need a clear break above $7,580
Also, a shout out to @famunger for his daily Analyst Summaries over the past months.