I don't believe in such a volatile market that this illustration is oversimplifying things. Plus, it's happened a lot of times already in the past! Let's not underestimate here as we could go onto a terribly confusing and technical analysis, or, just paint a simple picture of past activity ....
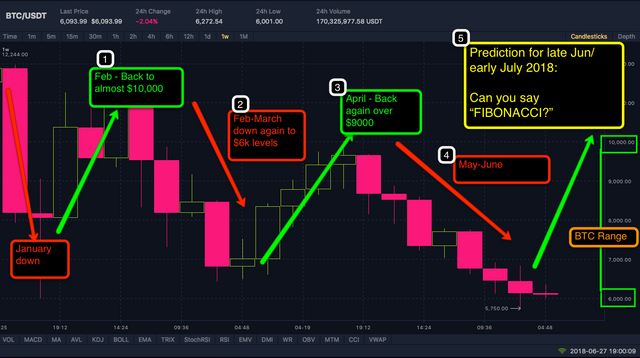
The image says it all, as I've added the annotations. Basically, we can see two previous bounces and the third, following fibonacci levels could actually be much higher i.e. $12500 or more per Bitcoin.
Let me know you're predictions in the comments, will they be true, or wishful thinking?