Where I see Bitcoin Trending For New Years and in 2018
This is not investment advice. I am not a professional investment adviser, I am merely someone (probably like you) that takes a keen interest in watching market patterns and learning to see where those patterns may go. There are a multitude of different strategies to predict where the market can or will go, but no one alive can predict any market with 100% accuracy. If you choose to invest your money, or someone else's money into Bitcoin or any other speculative market, you take full responsibility for the outcome. The smart approach, if you are not comfortable making your own predictions, is to look at the predictions of as many people as possible, and somewhere in the middle you will find the most likely outcome. Even a stopped clock is right twice a day, so any detailed prediction I make can and should be considered luck. The wilder the prediction, the less chance the prediction will happen.
(images can be enlarged into a new window by doing shift+click, or ctrl+shift+click for a new tab)
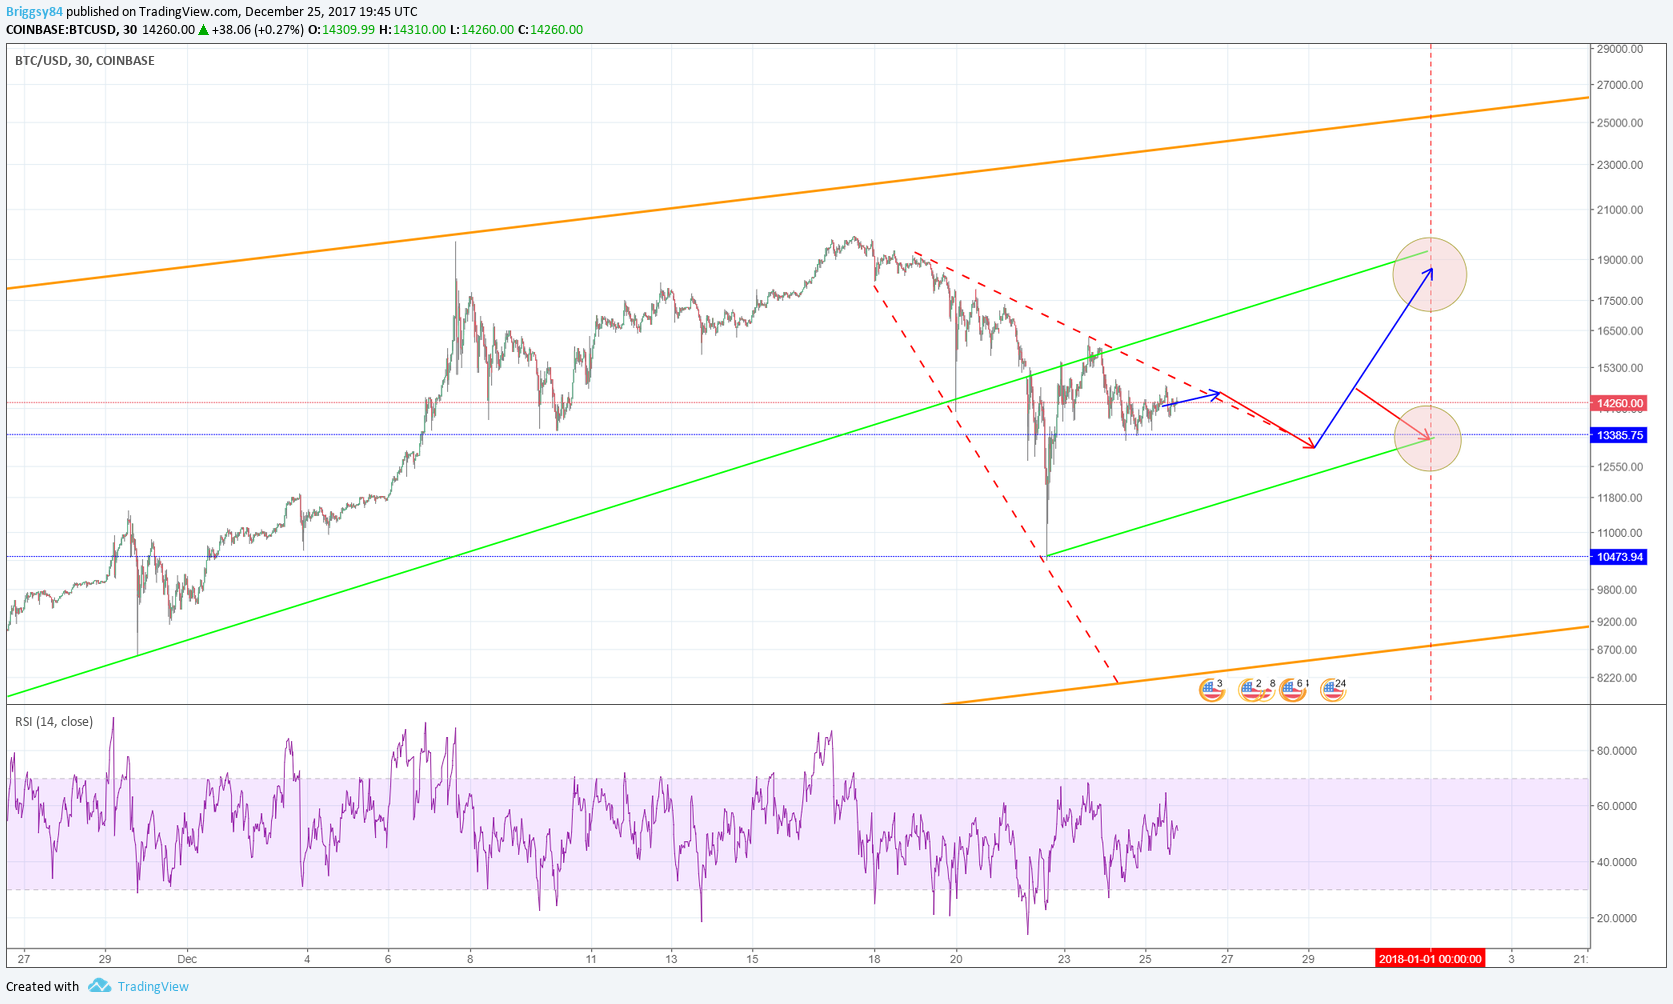
Yesterday I was looking at the Bitcoin to USD chart for Coinbase on Tradingview.com, and I believe there is a good possibility of continuation trend forming in the short term. I took this screenshot just now, and so far my guess has been accurate (the blue and red solid arrows), but those are just my own gut feeling as to where the price could go. The two green lines appear to be a good channel for bitcoin to follow in the coming week, and falling anywhere between 13,000 and 19,000 USD by New Years Day.
.png)
Please invest wisely though, and don't just look at what I am saying, but look at many other people's thoughts as well. I prefer to follow the philosophy of KISS (Keep It Simple Stupid), and so looking at the RSI (relative strength index), long-term logarithmic trends, and short-term developments is what I prefer. There are many other tools available, and many different patterns and formations to be considered when hoping to predict price movements.
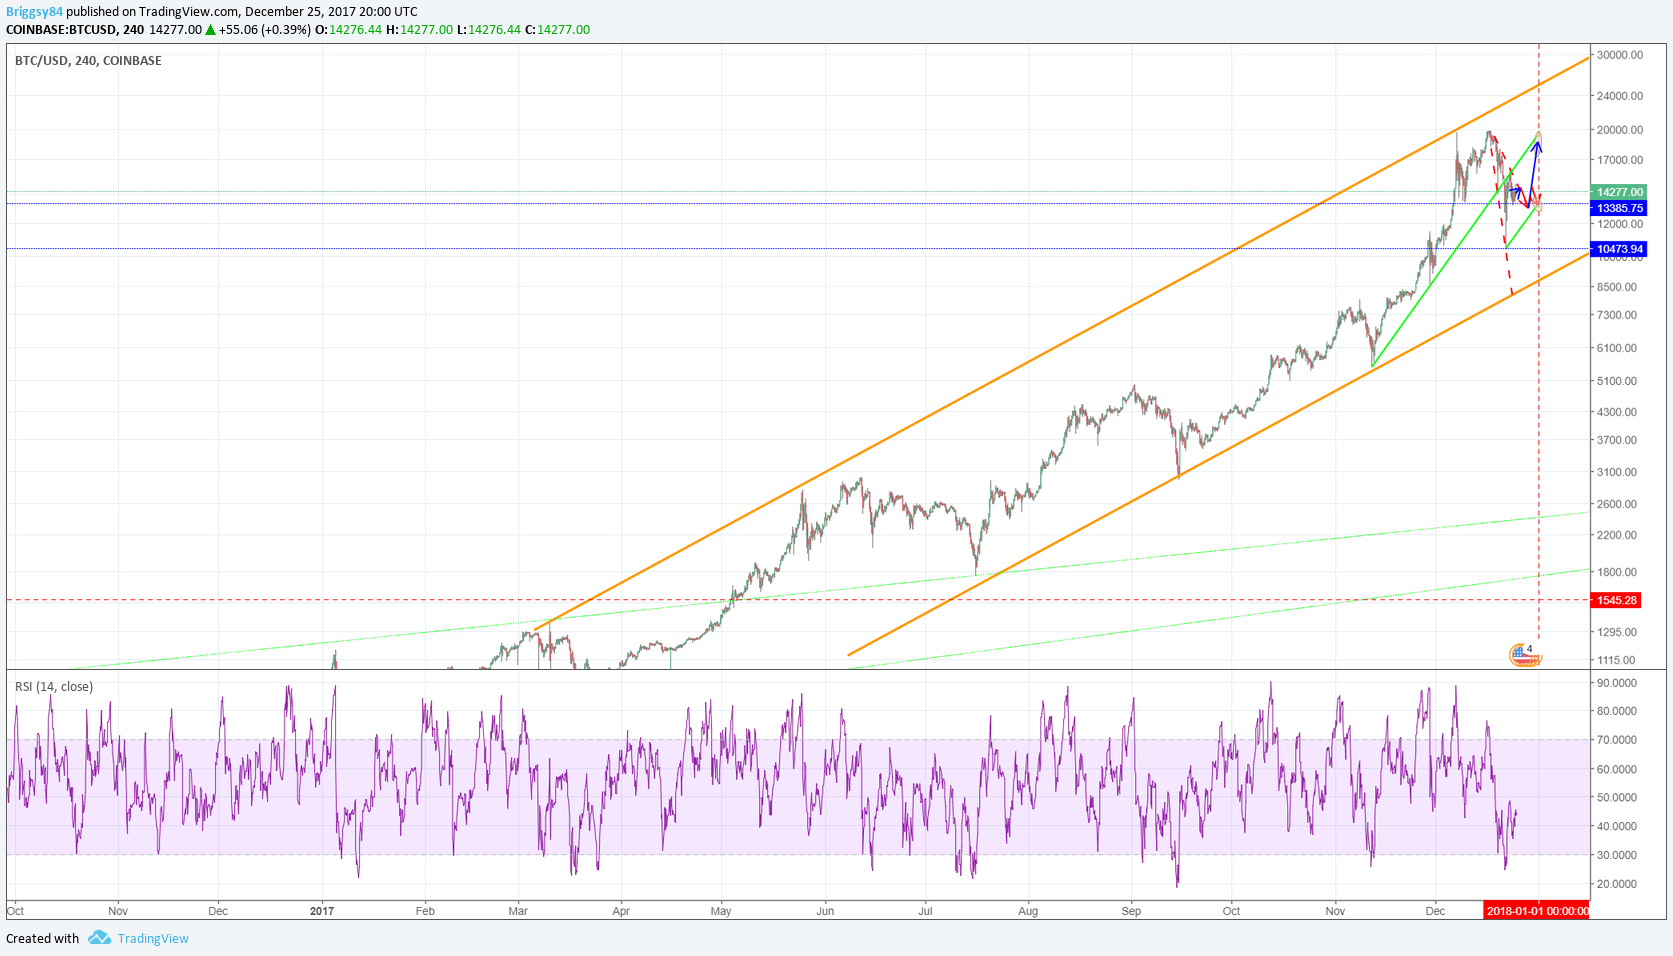
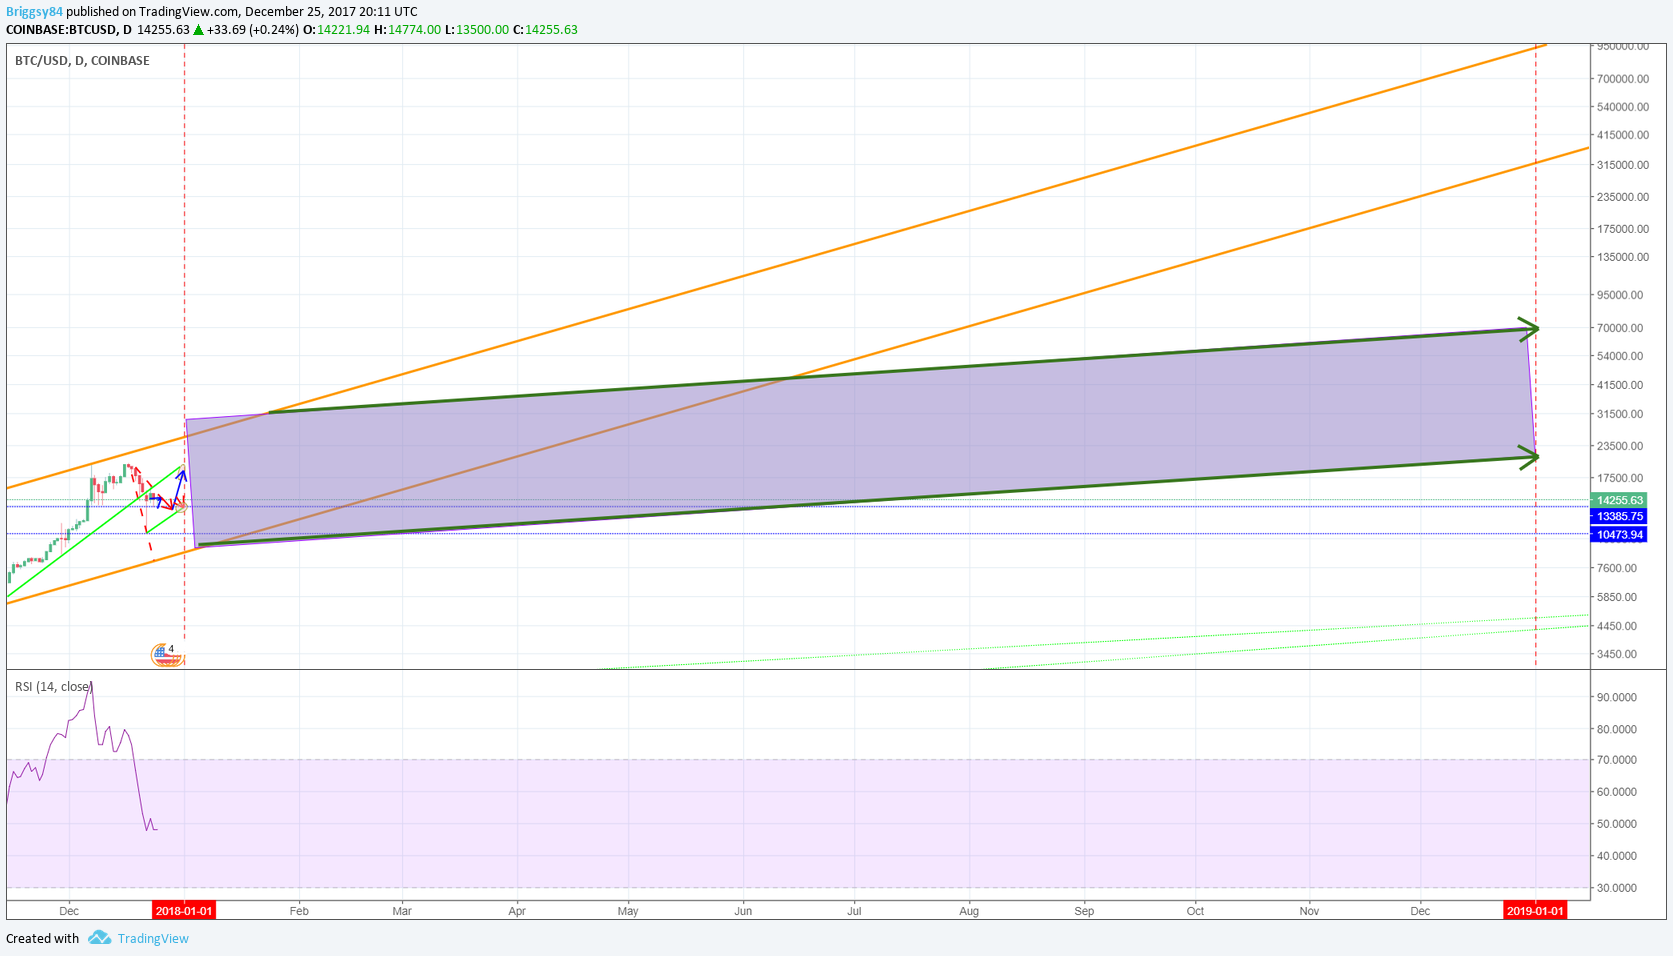
In the long-term trend, I don't see bitcoin holding such a steep continuation trend for too much longer, because this would mean by year 2020 a Bitcoin could be worth 32,000,000 USD, which I find very unlikely without the USD seeing horrible runaway inflation (which may be possible with the Petro Yuan surfacing). The two orange lines represent the continuation trend we have seen for 7 months now. This trend needs to settle down, and I believe it will in 2018. Remember this chart is not linear, but Logarithmic, so it may look different than a regular chart, but is also more accurate for seeing trends.
In 2018 I expect to see a continuation trend with a little more sanity, but prone to more volatility. If Bitcoin does not settle down into a more levelled off trend in 2018, expect some blood baths and lots of Bitcoin obituaries.
I will continue to watch Bitcoin like the rest of you, and I'm keeping my fingers crossed for a large dip to get some more. The next two weeks could see some swings, so don't panic if you see a crash, and take some profits if BTC really shoots high.
link to live chart: https://www.tradingview.com/chart/BHUUjolC/
Bonjour, quel superbe article, il est très bien détaillé, ça à dû vous prendre beaucoup temps, pas vrai ?
Vous méritez d'être plus populaires sur la plateforme steemit, car votre travail fourni et passionnant et très impressionnant ;)
Ravie de vous connaître, mon nouveau ami.
J'espère que tu pourras aller voir mon contenu sur mon blog ;) et tu donne ton avis, ok ?
https://steemit.com/@katouna
Bonne journée ;)