Will bitcoin find resistance at $ 13000 ?
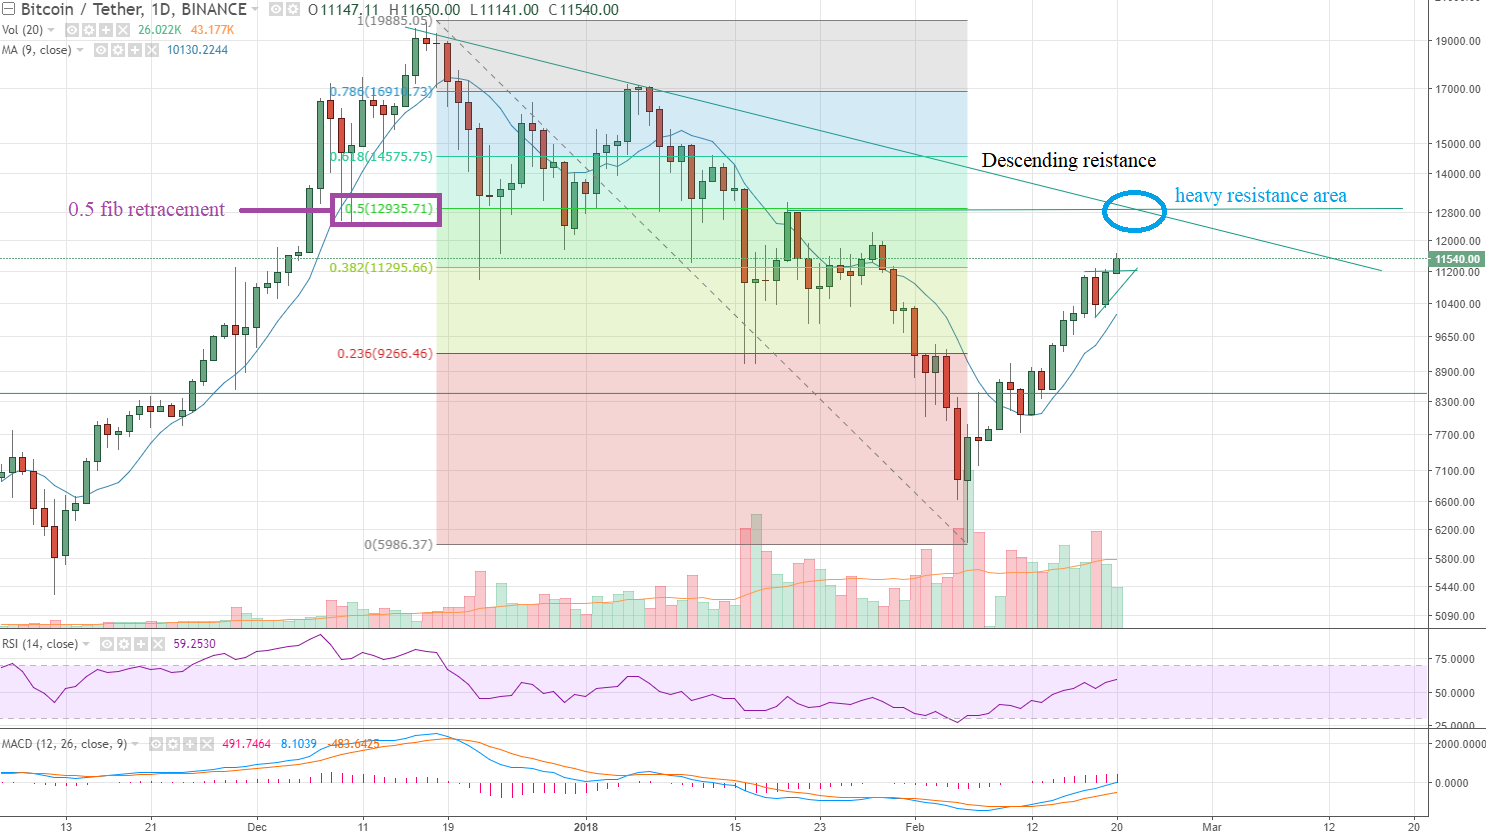
Bitcoin is recovering from the relative long (in the cryptocurrency world) correction. It almost doubled from the bottom on 2 February 2018 when bitcoin hit $ 6000. This recovery may find some resistance around the $ 13000 level. This level corresponds with a previous top which acts now as a resistance. This resistance falls together with the Fibonacci Retracement level of 0.5. The descending resistance converges with these resistances (blue circle on the image below). If bitcoin rises at the same rate as it does now, it may bounce of this heavy resistance area. The daily RSI (59) isn't high but if it keeps rising, it may come in the overbought area.
If we take a closer look, bitcoin is very bullish stairstepping upwards. As I mentioned before, this rise may find some resistance at the $ 13000 level. A red rectangle is placed right under the resistances. Right above it is a green rectangle. The red rectangle may represent selling due to profit taking. It is a bullish sign if bitcoin breaks through the resistance, this may lead to a buying oppertunity.
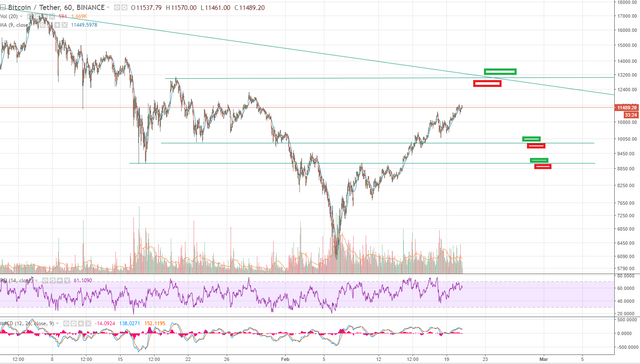
If bitcoin would bounce of these resistances, then there might be some important levels to watch around $ 9800 and $ 9000.
Disclaimer: This is not financial advise.
I just want to give my humble opinion on some products by doing technical analysis. There may be some minor and/or major flaws. Nobody is perfect and I'm willing to learn from my mistakes through your opinions. Thank you.
Money making posts:
https://steemit.com/money/@bo3ia/how-to-make-money-in-stocks-and-cryptocurrencies
https://steemit.com/money/@bo3ia/make-money-with-the-s-and-p500-index
https://steemit.com/cryptocurrency/@bo3ia/risk-management-in-cryptocurrency-and-stocks
Image source: https://www.tradingview.com/
Seems like you were spot on!