Daily Crypto Technical Price Analysis – Bitcoin, Ethereum & Bitcoin Cash, 9th July 2018
Bitcoin is representing a fall of 0.3% in last 24-hours.
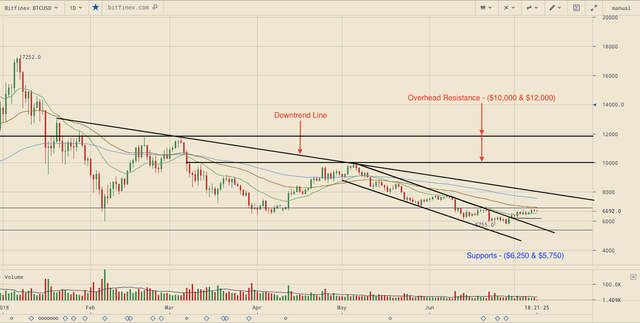
As we mentioned in our previous weekly analysis, BTC having moved over the descending channel has formed the likeliness of the short-term bullish view which will face immediate resistance close to the $6,950 – $7,000 level which also collides with the 50-day EMA.
Despite little action, BTC has managed to maintain its minor gains over last few days and is consolidating on higher levels which gives us an optimistic view. A breach over the 50-day EMA will open BTC to move higher to long ranged downtrend line currently representing at $8,000.
Conclusion : BTC finds short-term bullish view with the immediate hurdle of $7,000 to be crossed. On lower side $6,400 and $6,250 forms intraday support with latter being a stronger support. Our analysis will be invalidated if BTC falls below $6,250.
Ethereum:
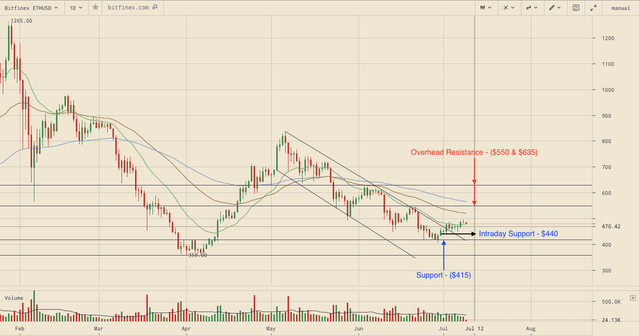
Trading at $470, ETH is representing a 0.8% fall in last 24-hours.
ETH chart is looking similar to the one of Bitcoin, where the respective asset has moved over its immediate resisting line of the descending channel. ETH forms next resistance at the level of $550 and hence, a potential move towards the particular level can be expected in coming time with immediate intraday support at 440.
On lower side, $440 and $415 forms strong support for the relative short-term bullish view. A move to $550 and if breached, can further take the momentum up till $635 where there will be very stiff resistance formed.
Our short-term bullish view will be invalidated if ETH falls and gives a day-close below $440.
Bitcoin Cash:
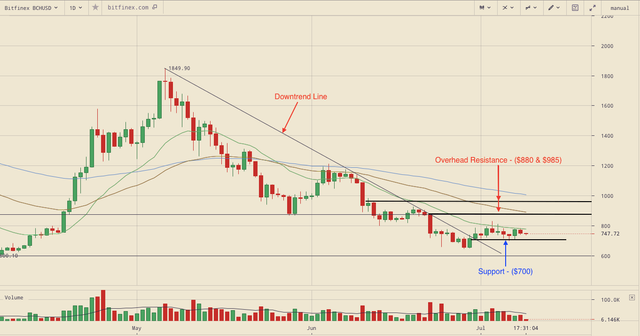
BCH is representing a fall of close to ~3% in last 24-hours and has been among the weakest of all the major cryptocurrencies by market capitalization.
BCH having moved over the downtrend line of resistance has still not gained interest among the buyers to get its price over the 20-day EMA and is constantly resisting against the same. The inability to move over the 20-day EMA puts the pull-back BCH pull-back theory in jeopardy.
Bulls, in order to succeed will have to defend their immediate support of $700 and move over the 20-day EMA for a move up to its overhead resistance of $880 and then, $985 respectively. A break-down and close below $700 will invalidate the short-term bullish trend which BCH has tried to establish crossing the downtrend line.
Traders can smartly use their skills and can refer to the technical levels above to make their own optimised trade decisions. Happy Trading..!!
Regards,
Bitcoin Newser


Nice read. I leave an upvote for this article thumbsup
Thanks Tomask-de : )