BTC 18 Jan - Medium to Long-term forecast updates
This post is a look at how we are doing based on previous forecasts, and consequently what we can expect in the medium to long-term future.
 A Bit Brain original
BTC 18 Jan - Medium to Long-term forecast updates
On 15 Jan I published a medium-term BTC forecast. The chart below is taken from that post, unmodified but for the candles that have been added since then.
So far the post holds true, BTC is still in a tapering triangle, fast approaching the breakout zone. It will reach the breakout zone approximately 24 hours from now. From that point onwards a breakout becomes likely, probability of the breakout increases with time.
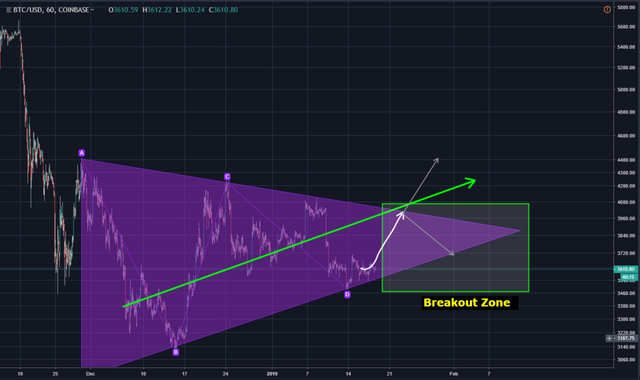 Made by Bit Brain with TradingView
A zoomed in view shows that my prediction line (in white) was fairly good (this time). Note that the long green arrow is the medium-term trendline. The small grey arrows are breakout possibilities, upwards being the more probable of the two (read the 15 Jan forecast for details).
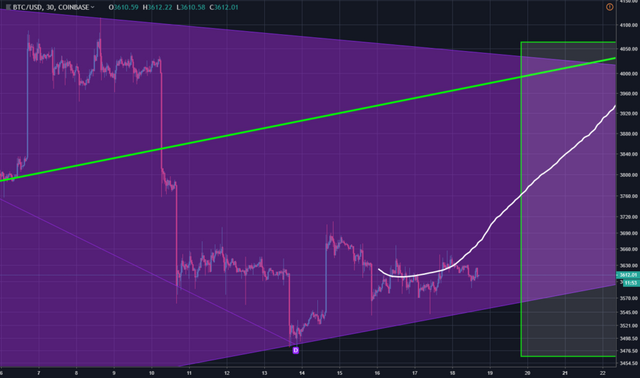 Made by Bit Brain with TradingView
The tapering triangle is well established and so obvious that you can see it easily on the 7d CMC chart.
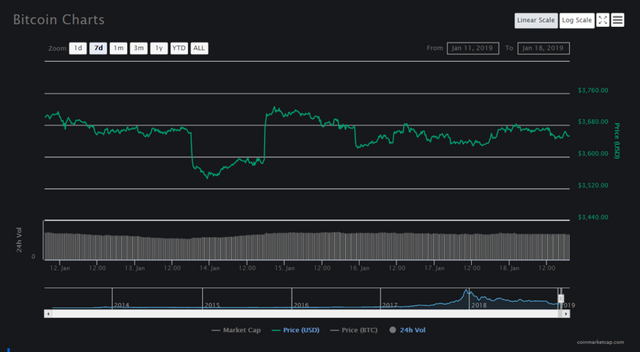
You can even see it fairly clearly on the BTC sparkline. (Word of caution: Normally sparklines lack detail, so be careful and wary of their limitations if using them for some rapid assessment TA, they can be deceptive.)

Zooming way out to get the long-term picture, I noticed something rather positive: the medium-term trendline (that green line seen on the first two charts) is starting to tie in rather well with what I shall call the long-term base price trendline (the line that BTC runs along when the market isn't hyped).
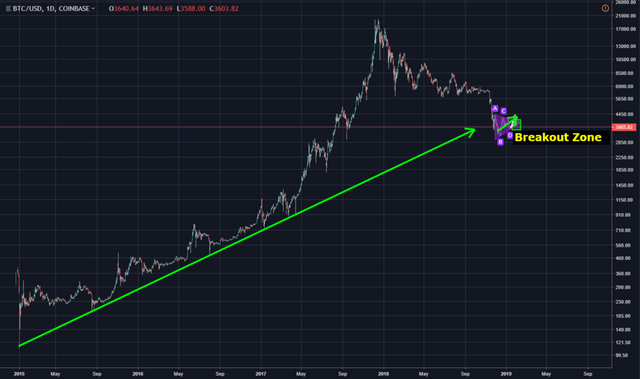 Made by Bit Brain with TradingView
Switching exchanges to BitStamp (which has older data available and which I usually use for long-term TA), you can see where we are on my standard long-term trendlines. I haven't had to update these since my post of 17 December (where I attempted to draw them as accurately as possible), so they are holding true too. If BTC continues to behave as expected, then it should follow something roughly approximate to the blue curve shown below.
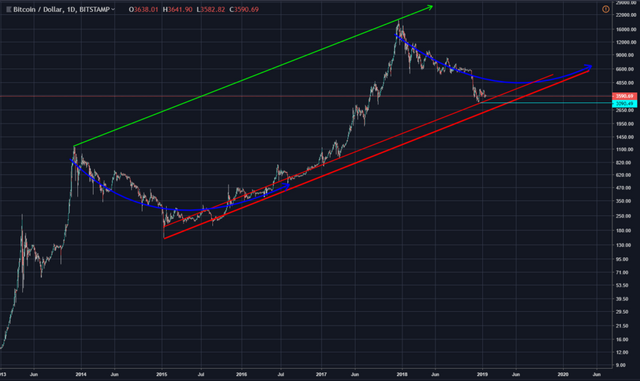 Made by Bit Brain with TradingView

The behaviour of Bitcoin continues to strengthen the argument that capitulation has already taken place and that BTC will not dip to new 1 year lows before climbing again. The longer this continues, the more the prospect of a Dead Cat Bounce looks, well, dead. Just be careful of those nine lives...
Read more on the topic here:
- The NEED for Crypto to Capitulate
- To CAPITULATE or NOT to CAPITULATE? That is the question. – Part 1: The Question
- To CAPITULATE or NOT to CAPITULATE? That is the question. – Part 2: The Answer
- To CAPITULATE or NOT to CAPITULATE? That is the question. – Part 2(b): (The rest of) The Answer

Footnote: take a look at ETHOS if you have not already done so! You should have done so already, because I'm CERTAIN that you follow me on Twitter and that you read this Tweet!
Yours in crypto
Bit Brain

Bit Brain recommends:
Crypto Exchanges:


 ---
---
Published by BitBrain
on


For this analysis, I can also add a large number of lines, coming from several important maximum prices, such as the ATH of 2017 and 2018, which have lines to break from next January 20 and with a positive attitude apparently. If we break them, we would get much closer to other lines of lesser time, which belong to the maximum prices of last year per month. I dare say that if all these were broken in a span of 2 weeks, we would see btc with candles, like Steem today.
But nothing is also safe, I still worry about the time we have to consolidate over the EMA 40, plus the failure a few days ago to try to pass the MACD line and how complicated the resistance has become in 4000 $
Good luck, regards!
Okay -
is where you lost me!
I wouldn't worry too much about short and medium term EMAs. You'll have to be a little more specific about the MACD settings but I assume you're referring to a crossover on the daily? In that case I would say that it was a little early to expect a cross on the 19th (when it came close), but that it will quite possible still happen within this week.