Bitcoin, Ethereum, Ripple, Bitcoin Cash: Price Analysis, October 22
BTC/USD
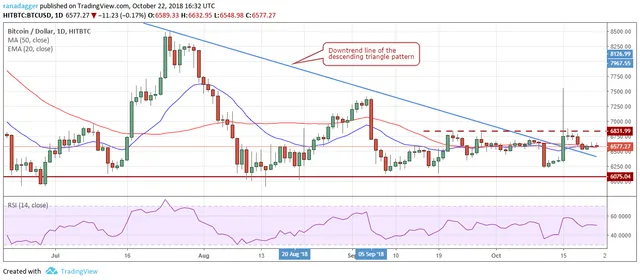
Bitcoin dipped below the moving averages on Oct. 19, but the bears could not capitalize on the fall, as the price climbed back up the next day. The 20-day EMA is flat while the 50-day SMA is gradually sloping down. The RSI is at the midpoint. All the indicators and the price action suggest a state of equilibrium between the buyers and the sellers.

Type caption for image (optional)
If the bears break below $6,500, the fall can extend to $6,200. The critical level on the downside is the support zone of $5,900–$6,075.04. If this breaks, we anticipate panic selling that can result in a steep decline.
On the upside, a break out of $6,831.99 will attract buying and force the short sellers to cover their positions, propelling the BTC/USD pair to $7,400.
Volumes have dropped and there is no confident trading either from the bulls or the bears. We have to wait for either party to make a decisive move. Until then, sluggish, range bound action is likely to continue. Traders who own long positions can keep a protective stop at $5,900.
ETH/USD
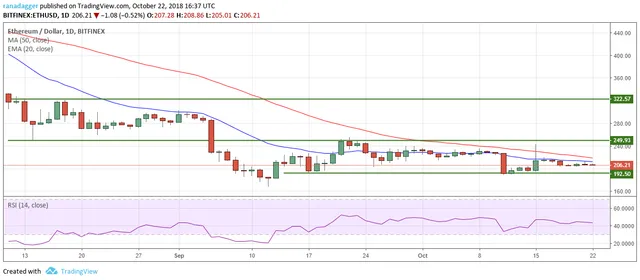
Ethereum continues to trade below both moving averages, which is a negative sign. It can now slide to the first support at $192.5, below which a retest of the Sept. 12 low of $167.32 is probable.

Type caption for image (optional)
On the upside, if the ETH/USD pair breaks out of the moving averages, it can reach the top of the $192.5–$249.93 range.
The digital currency will become positive if it can scale $250. If the bulls sustain above the range, a rally to $322 is probable. We can’t find any setups as long as the price remains inside the range.
XRP/USD
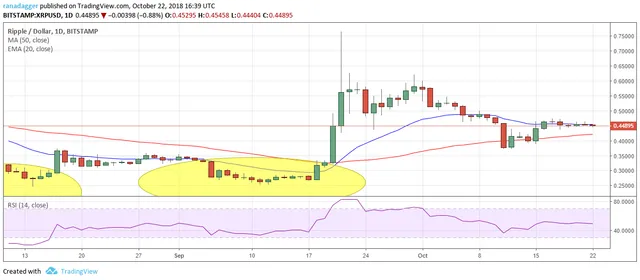
The bears have successfully defended the 20-day EMA for the past four days. Ripple can now correct to the 50-day SMA, which might act as a support.

Type caption for image (optional)
If the bears break below the 50-day SMA, the XRP/USD pair can drop to $0.37185. On the upside, a break and close (UTC time frame) above the 20-day EMA can carry prices to $0.5, $0.55, and further to $0.625.
We couldn’t find any reliable buy setups at the current levels, hence we are not suggesting any trades in the pair.
BCH/USD
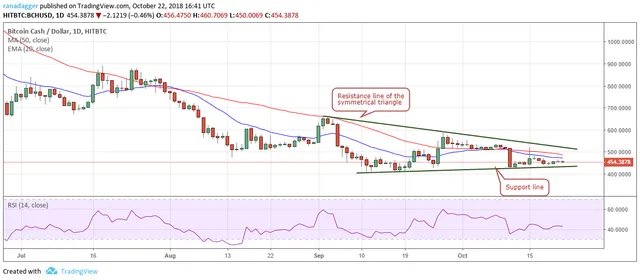
Bitcoin Cash is struggling to bounce off the support line of the symmetrical triangle. The price has failed to rise above the 20-day EMA, which is a bearish sign. Both moving averages are sloping down and the RSI is also in the negative territory. This shows that the bears have an upper hand.

Type caption for image (optional)
A break down of the triangle and the Sept. 11 intraday low of $408.0182 will resume the downtrend, pushing the price to the next support at $300. Therefore, traders can keep a stop loss at $400 on their existing long positions. The BCH/USD pair will show signs of a pullback if it breaks out of the triangle.