Bitcoin Cash (BCH) - Analysis (300% PROFIT POTENTIAL)
Who Wants To Fly With Roger Ver To The Moon? 🚀
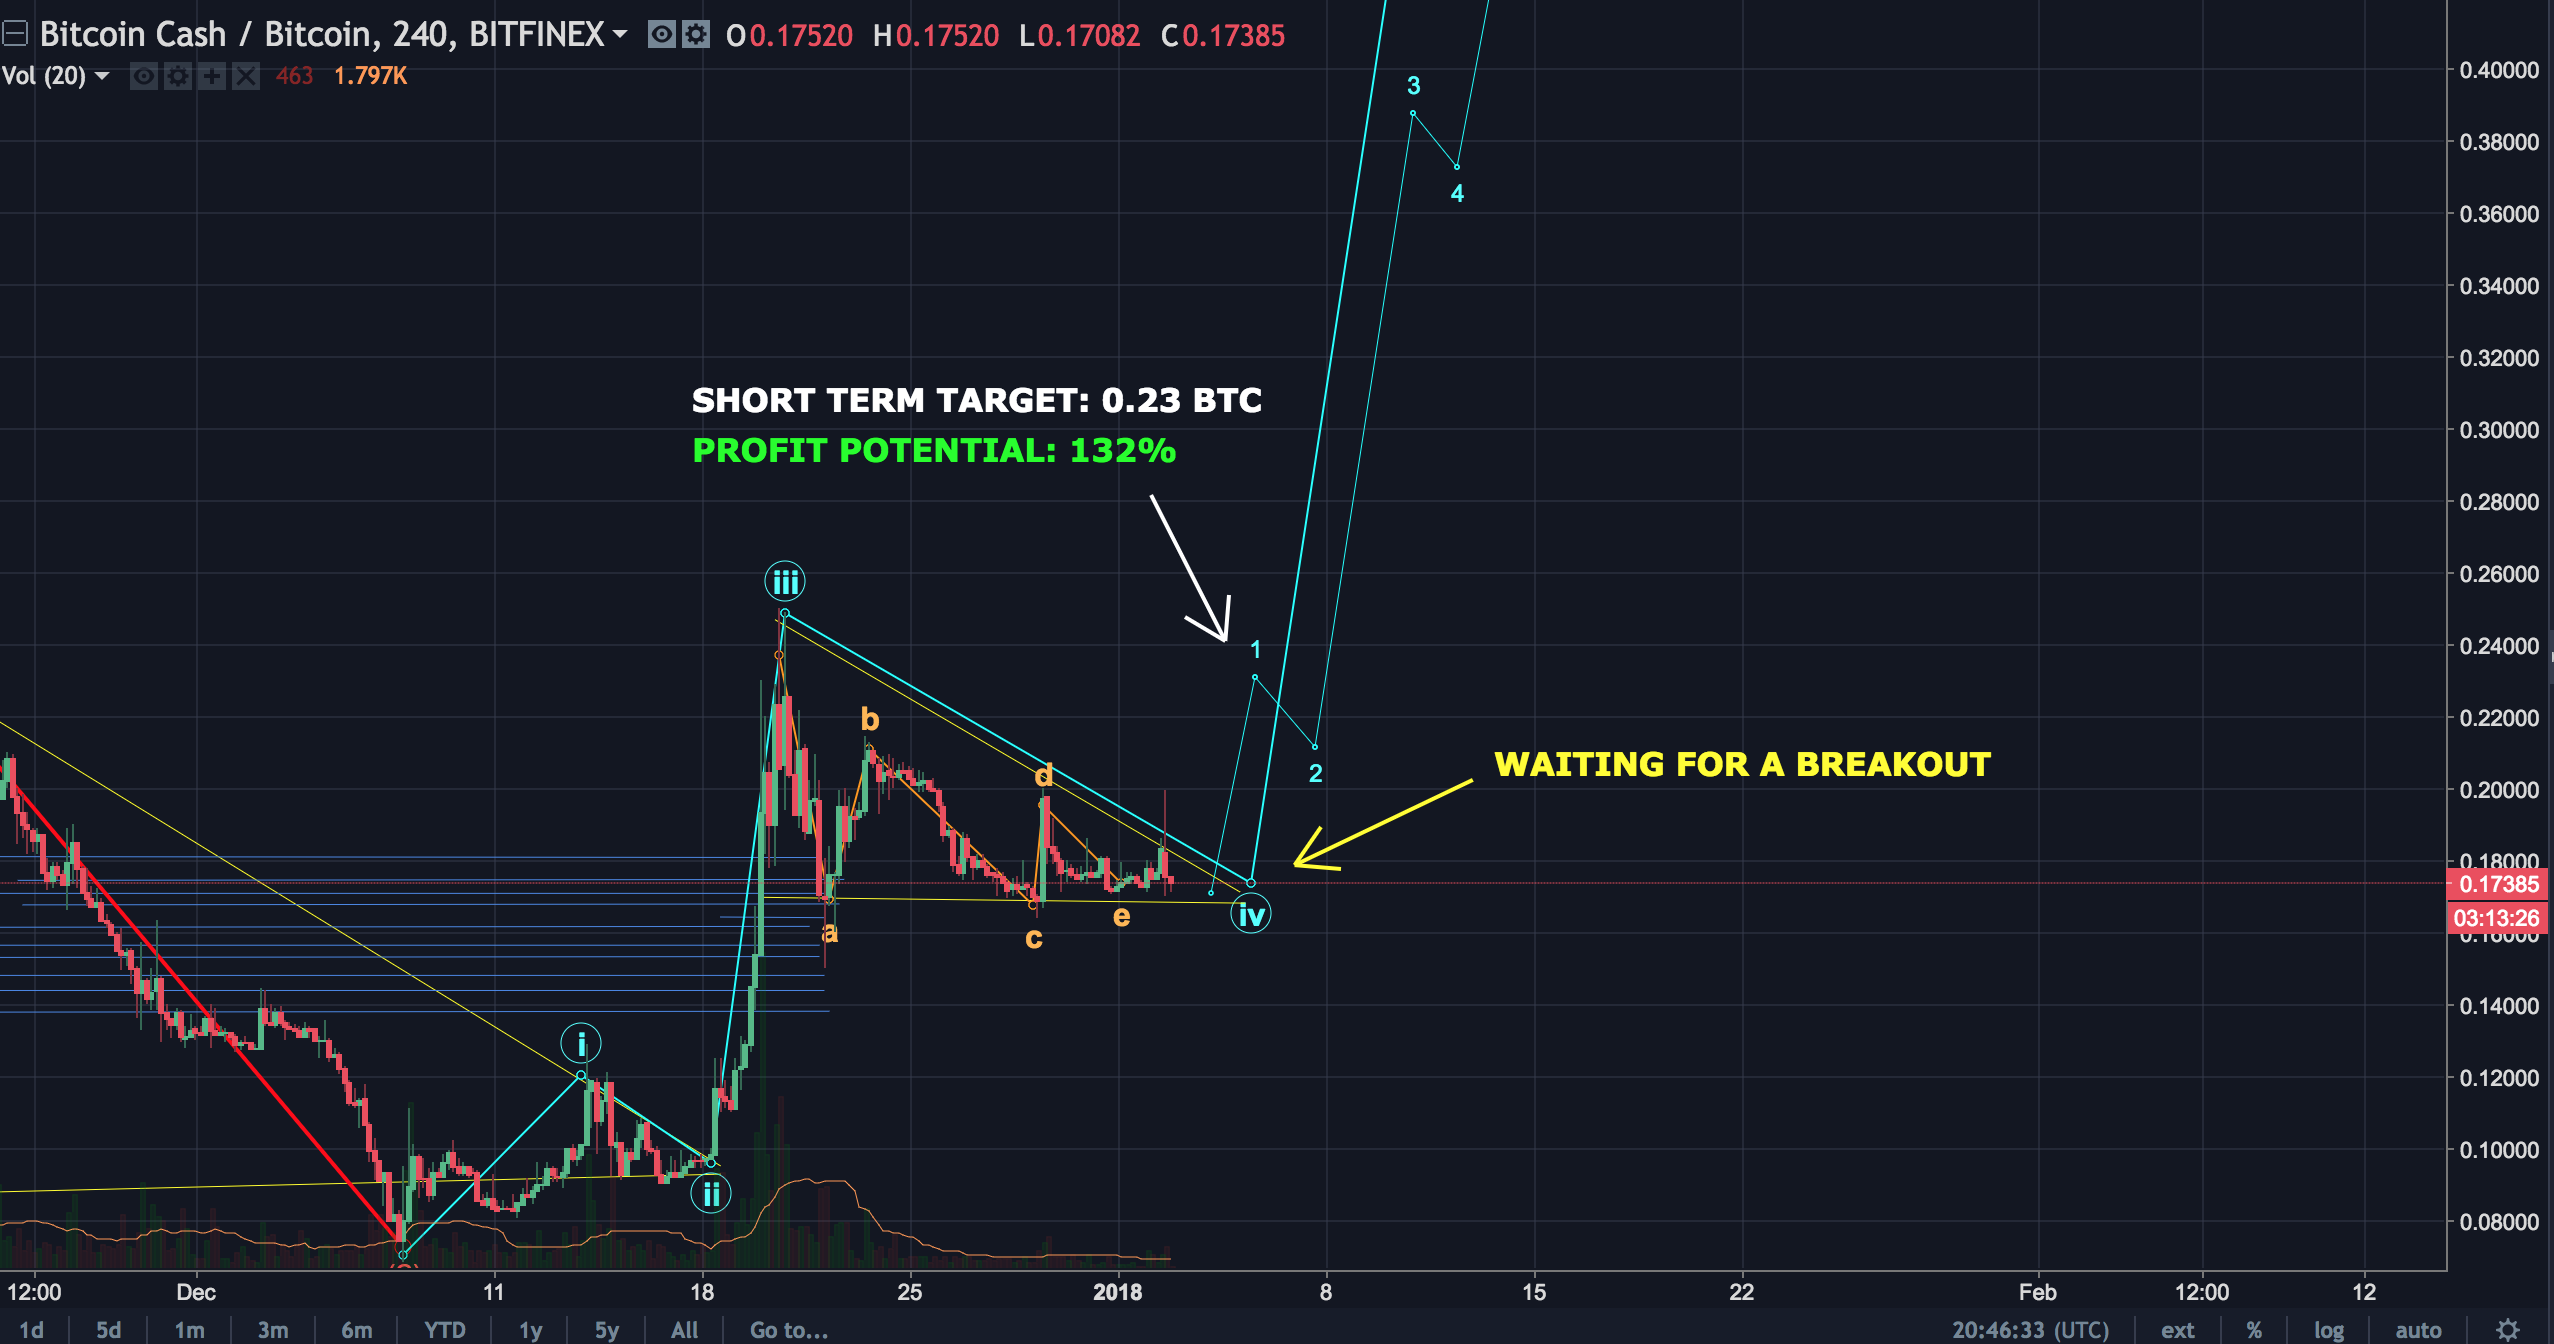
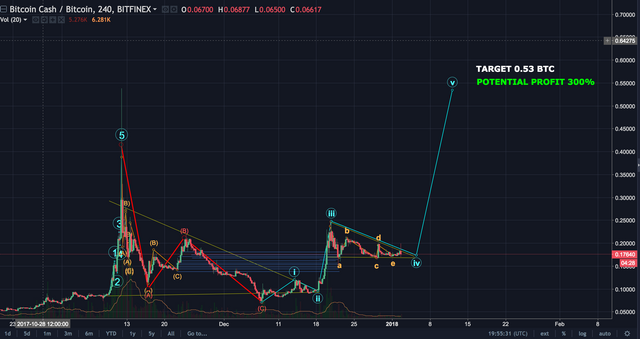
Bitcoin Cash has been correcting and forming a nice looking triangle. We recently pierced quickly through the upper line of the triangle but big brother Bitcoin bull run ruined the party. When all dust has settled there's a high probability that BCH will break the triangle again and head for the long term target of 0.53 BTC. If you're conservative, wait til we breakout again with some nice volume.
Since this impulse will probably be the 5th Elliot Wave, I've lowered this investment rating to 3 stars cause the potential is lower than other coins. What do you guys think?
Wishing you all the luck and major gains!
Investment summary:
⭐⭐⭐ 3 out of 5 stars on this investment
🤑 Short Term Target at 0.23 BTC
💲 Potential profit 132%!
🚀 Long Term Target at 0.53 BTC
💲 Potential profit 310%!
Please Upvote and Resteem if you like this analysis!
Follow me on Twitter at http://www.twitter.com/benkalashnikov
The bigger picture:
Disclaimer:
I'm not a financial advisor and these are only my opinions. I don't take any responsibility for any investments that you make based on my analysis.
Hi,
could you please analysis on pls
Streamr DATAcoin ,Yoyow
thanks
Hi, yeah tomorrow my friend!
thank you very much
Here's my analysis on YOYO. Two potential pathways but still same target. I would buy in if we break the triangle upwards with some nice volume.
Basicly you are telling that BCH will breakout of this triangle and go up 200%! (not 300% like you tell) in 7days? A triangle breakout to the upside (like in your pic) normaly is heading for a target like +0.1 which would be 0.27.
Do you realy think something like what you draw is a "normal" marketmovement? or more likely a pump?
Edit:
I can not upvote your post because it got some clear mistakes. If you change the clear mistakes i consider a upvote.
Yeah, things can move fast so it's not impossible. Time is difficult to predict so I wouldn't look at that too much. The purpose of the analysis is more potential price pathway. In this day and age, pump or normal market movement, I don't know, I just see huge potential when looking at the chart and counting the EW.
I trade time not price. So how you get from iv to v? i mean what is the rule in EW system to draw it like this? is the 300% correct in your pic? or my 200%?
If you look at the first sequence of EW at the beginning at around dec 13th you'll see that the 5th wave is extended. Therefore my prediction is that the 5th wave of this new EW sequence will be similar. Depending on how we break the triangle the pathway will change but target still remain same imo. And yes 200% is correct, my Tradingview was showing wrong percentage.
Did you hear about: "If your data is wrong then even a good processing unit will get wrong results." You have to recognise that.
On 13th dec i can not see something like 5th wave. Or you mean around 13 nov?
I consider a lot in this graph as pump. Why you buy this if nobody is useing it?
Yeah nov 13th, early morning here :) Some coins like Steem, EOS, Cardano, Bitshares I buy because of strong fundamentals and team. For me BCH is just for flipping and making profits.
Roger will just exit scam with all his bch sooner or later.
BTC got segwit locked in. They just need to build lightning. Actually you can write code on your own on top of it.
Its just propaganda now btc has to resist this year.
Bigger blocks dont work for all on the earth.
What nonsense... Why would Roger "exit scam" when it's clearly the most ready to go global currency for 2018 and beyond?
I advise you stop listening to the actual propaganda (from the Core shills) and take note of the direction things are actually moving.