10 Statistical Price Predictions for 10 Cryptocurrencies — January 2018
 So, you’re sitting at your computer with money to invest.
You have made some good money already in the market, but you want more.
Cryptocurrencies have reached a record $600 billion in market value after the recovery, with the inevitable $700 billion mark right around the corner.
The price movement of top currencies remains a mystery. But it doesn’t have to be.
THE PAIN OF UNCERTAINTY
Cryptocurrencies are volatile, irrational beasts.
Simple methods of forecasting grossly over/underestimate the potential of a volatile currency.
For example, moving averages are used frequently to estimate future prices. Moving averages, however, suffer from many pitfalls that make them poor estimators of volatile markets.
Every great and successful investor has a plan. You will add one more tool to your arsenal today.
A BETTER METHOD FOR ESTIMATING CRYPTO PRICES
In my prior article about estimating the movement of Bitcoin Prices, I spoke of a method that is used frequently in the stock world to estimate prices.
This method is a Monte Carlo simulation using the geometric Brownian motion model.
I won’t cover off on the full methodology here, but essentially I am going to:
Get historical daily prices for 10 top cryptocurrencies
Calculate daily returns
Simulate a year
Simulate a year many times
By the end of the article, you will have the following:
A one-year simulation of top cryptocurrencies
Likely price range of each cryptocurrency
A downloadable model to complete yourself
A note on forecasting, simulations, and recommendations: Monte Carlo simulations are to be used as guidelines and tools, not as gospel. I am not offering financial or investing advice.
BITCOIN
What is Bitcoin?
You know what Bitcoin is, stop it.
One-Year Simulation
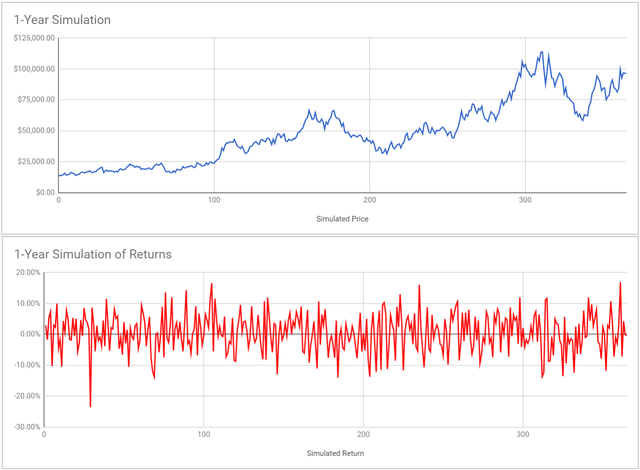
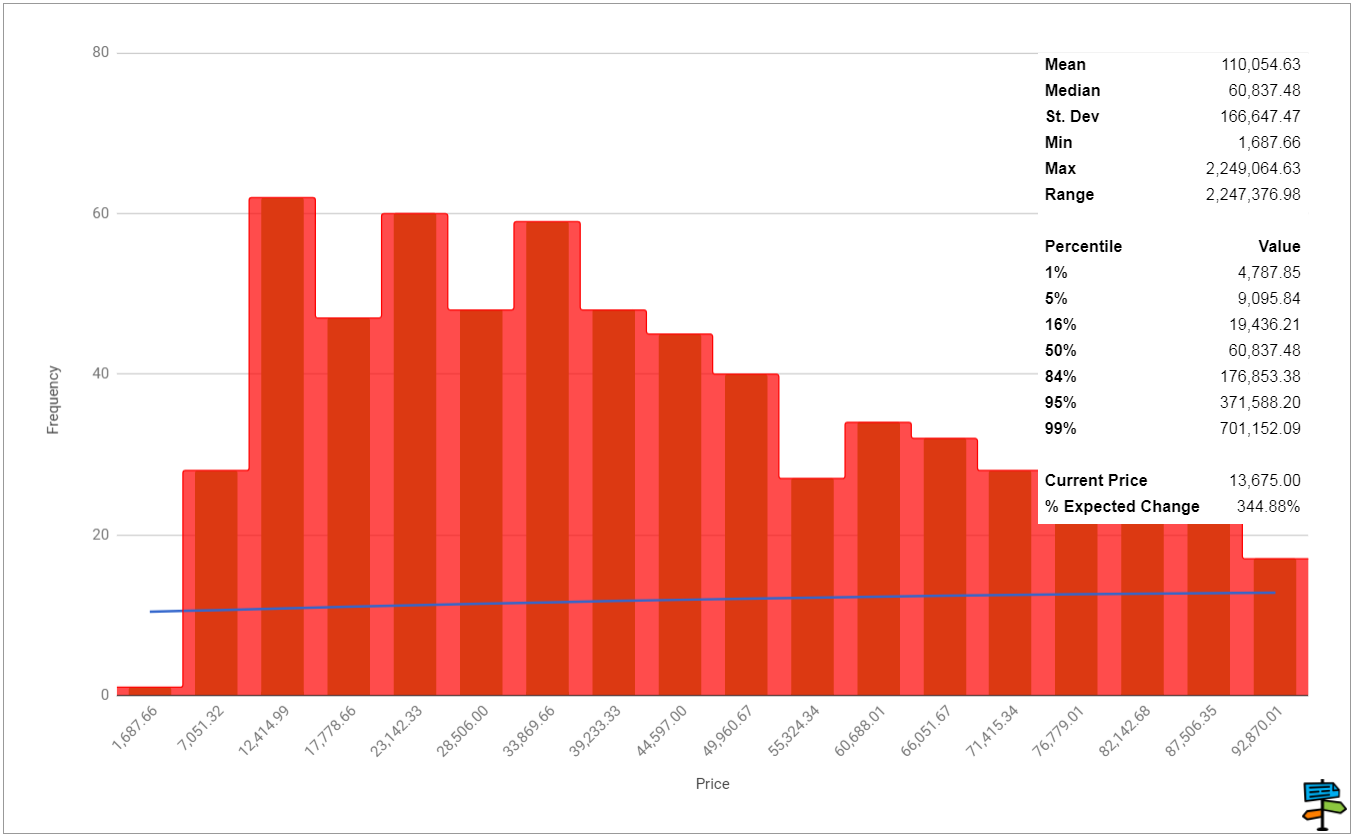
One-Year Simulated 1,000 Times
Go to the profile of John Young
John Young
Founder, Spreadstreet.io. Husband to the most beautiful woman in the world. Runner-up in 6th grade spelling bee. Super-nerd.
Dec 29, 2017
10 Statistical Price Predictions for 10 Cryptocurrencies — January 2018
So, you’re sitting at your computer with money to invest.
You have made some good money already in the market, but you want more.
Cryptocurrencies have reached a record $600 billion in market value after the recovery, with the inevitable $700 billion mark right around the corner.
The price movement of top currencies remains a mystery. But it doesn’t have to be.
THE PAIN OF UNCERTAINTY
Cryptocurrencies are volatile, irrational beasts.
Simple methods of forecasting grossly over/underestimate the potential of a volatile currency.
For example, moving averages are used frequently to estimate future prices. Moving averages, however, suffer from many pitfalls that make them poor estimators of volatile markets.
Every great and successful investor has a plan. You will add one more tool to your arsenal today.
A BETTER METHOD FOR ESTIMATING CRYPTO PRICES
In my prior article about estimating the movement of Bitcoin Prices, I spoke of a method that is used frequently in the stock world to estimate prices.
This method is a Monte Carlo simulation using the geometric Brownian motion model.
I won’t cover off on the full methodology here, but essentially I am going to:
Get historical daily prices for 10 top cryptocurrencies
Calculate daily returns
Simulate a year
Simulate a year many times
By the end of the article, you will have the following:
A one-year simulation of top cryptocurrencies
Likely price range of each cryptocurrency
A downloadable model to complete yourself
A note on forecasting, simulations, and recommendations: Monte Carlo simulations are to be used as guidelines and tools, not as gospel. I am not offering financial or investing advice.
BITCOIN
What is Bitcoin?
You know what Bitcoin is, stop it.
One-Year Simulation
One-Year Simulated 1,000 Times
Verdict
We can be 95% certain that Bitcoin prices will fall between $9,095, and $371,588 with a median of $60,837.
BITCOIN CASH
What is Bitcoin Cash?
From the Bitcoin Cash project website:
“Bitcoin Cash is peer-to-peer electronic cash for the Internet. It is fully decentralized, with no central bank and requires no trusted third parties to operate.”
Really, it was an additional currency that was created after a fork from Bitcoin core.
One-Year Simulation
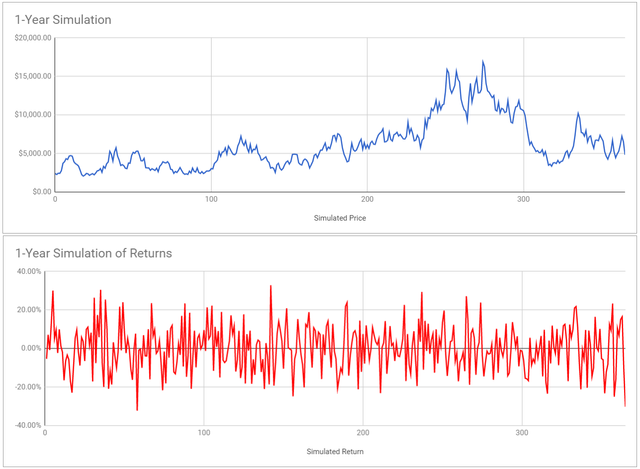
One-Year Simulated 1,000 Times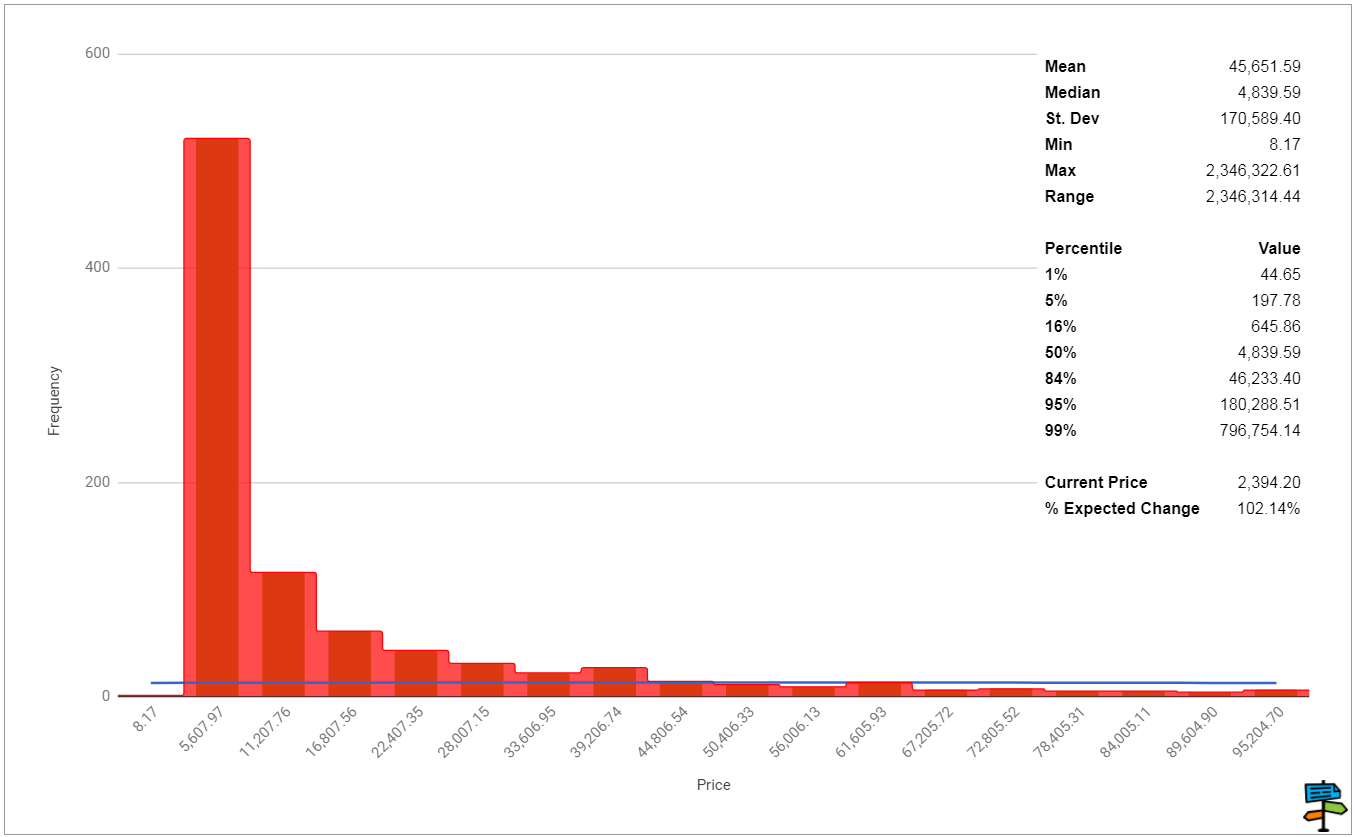
Go to the profile of John Young
John Young
Founder, Spreadstreet.io. Husband to the most beautiful woman in the world. Runner-up in 6th grade spelling bee. Super-nerd.
Dec 29, 2017
10 Statistical Price Predictions for 10 Cryptocurrencies — January 2018
So, you’re sitting at your computer with money to invest.
You have made some good money already in the market, but you want more.
Cryptocurrencies have reached a record $600 billion in market value after the recovery, with the inevitable $700 billion mark right around the corner.
The price movement of top currencies remains a mystery. But it doesn’t have to be.
THE PAIN OF UNCERTAINTY
Cryptocurrencies are volatile, irrational beasts.
Simple methods of forecasting grossly over/underestimate the potential of a volatile currency.
For example, moving averages are used frequently to estimate future prices. Moving averages, however, suffer from many pitfalls that make them poor estimators of volatile markets.
Every great and successful investor has a plan. You will add one more tool to your arsenal today.
A BETTER METHOD FOR ESTIMATING CRYPTO PRICES
In my prior article about estimating the movement of Bitcoin Prices, I spoke of a method that is used frequently in the stock world to estimate prices.
This method is a Monte Carlo simulation using the geometric Brownian motion model.
I won’t cover off on the full methodology here, but essentially I am going to:
Get historical daily prices for 10 top cryptocurrencies
Calculate daily returns
Simulate a year
Simulate a year many times
By the end of the article, you will have the following:
A one-year simulation of top cryptocurrencies
Likely price range of each cryptocurrency
A downloadable model to complete yourself
A note on forecasting, simulations, and recommendations: Monte Carlo simulations are to be used as guidelines and tools, not as gospel. I am not offering financial or investing advice.
BITCOIN
What is Bitcoin?
You know what Bitcoin is, stop it.
One-Year Simulation
One-Year Simulated 1,000 Times
Verdict
We can be 95% certain that Bitcoin prices will fall between $9,095, and $371,588 with a median of $60,837.
BITCOIN CASH
What is Bitcoin Cash?
From the Bitcoin Cash project website:
“Bitcoin Cash is peer-to-peer electronic cash for the Internet. It is fully decentralized, with no central bank and requires no trusted third parties to operate.”
Really, it was an additional currency that was created after a fork from Bitcoin core.
One-Year Simulation
One-Year Simulated 1,000 Times
Verdict
We can be 95% certain that Bitcoin Cash prices will fall between $197, and $180,288 with a median of $4,839.
ETHEREUM
What is Ethereum?
Ethereum is a decentralized platform that runs smart contracts: applications that run exactly as programmed without any possibility of downtime, censorship, fraud or third party interference.
Ethereum has been busy recently. Multiple steps have been pushed in motion for the upcoming large change — reaching a new consensus method.
From Jordan Daniel at ethnews.com:
Ethereum’s Byzantium hard fork was only one half of a two-part process designed to transition the decentralized application platform to a new method for reaching consensus — proof-of-stake. The next hard fork, called Constantinople, was recently discussed during an Ethereum core developer meeting and could include Vitalik Buterin’s Casper update.
One-Year Simulation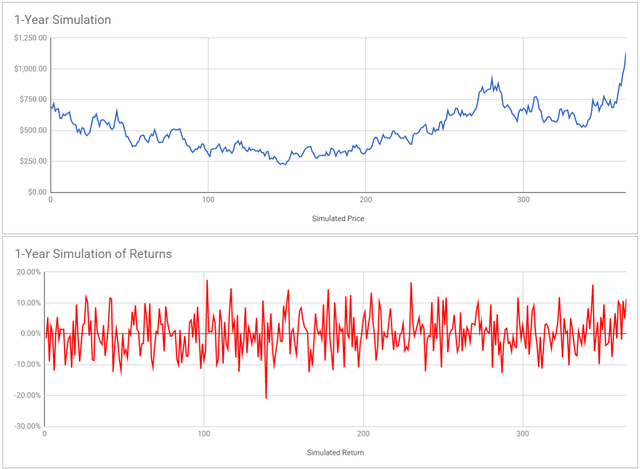
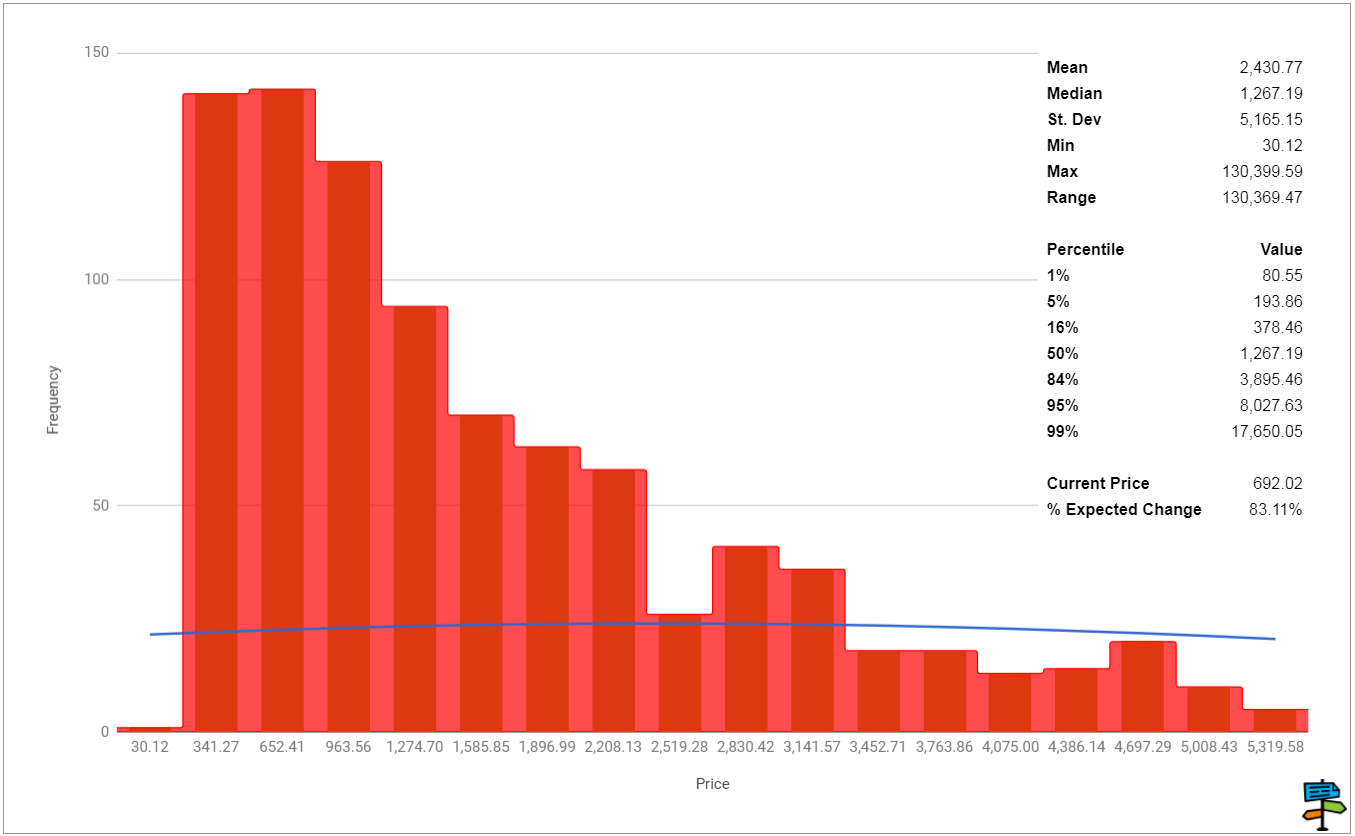
Verdict
We can be 95% certain that Ethereum prices will fall between $193, and $8,027 with a median of $1,267.
EOS
What is EOS?
EOS is a blockchain-based, decentralized operating system, designed to support commercial-scale decentralized applications by providing all of the necessary core functionality, enabling businesses to build blockchain applications in a way similar to web-based applications.
One-Year Simulation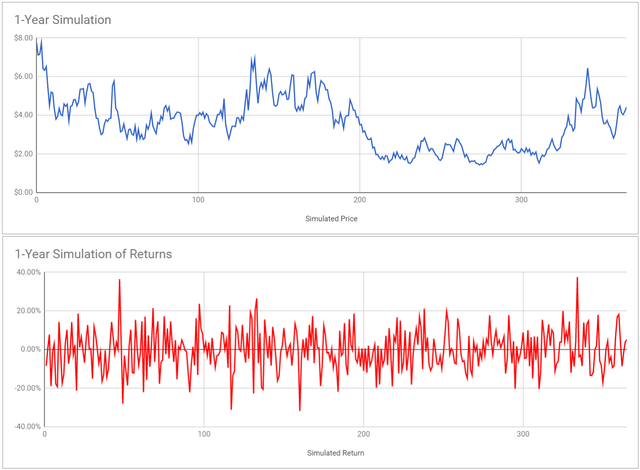
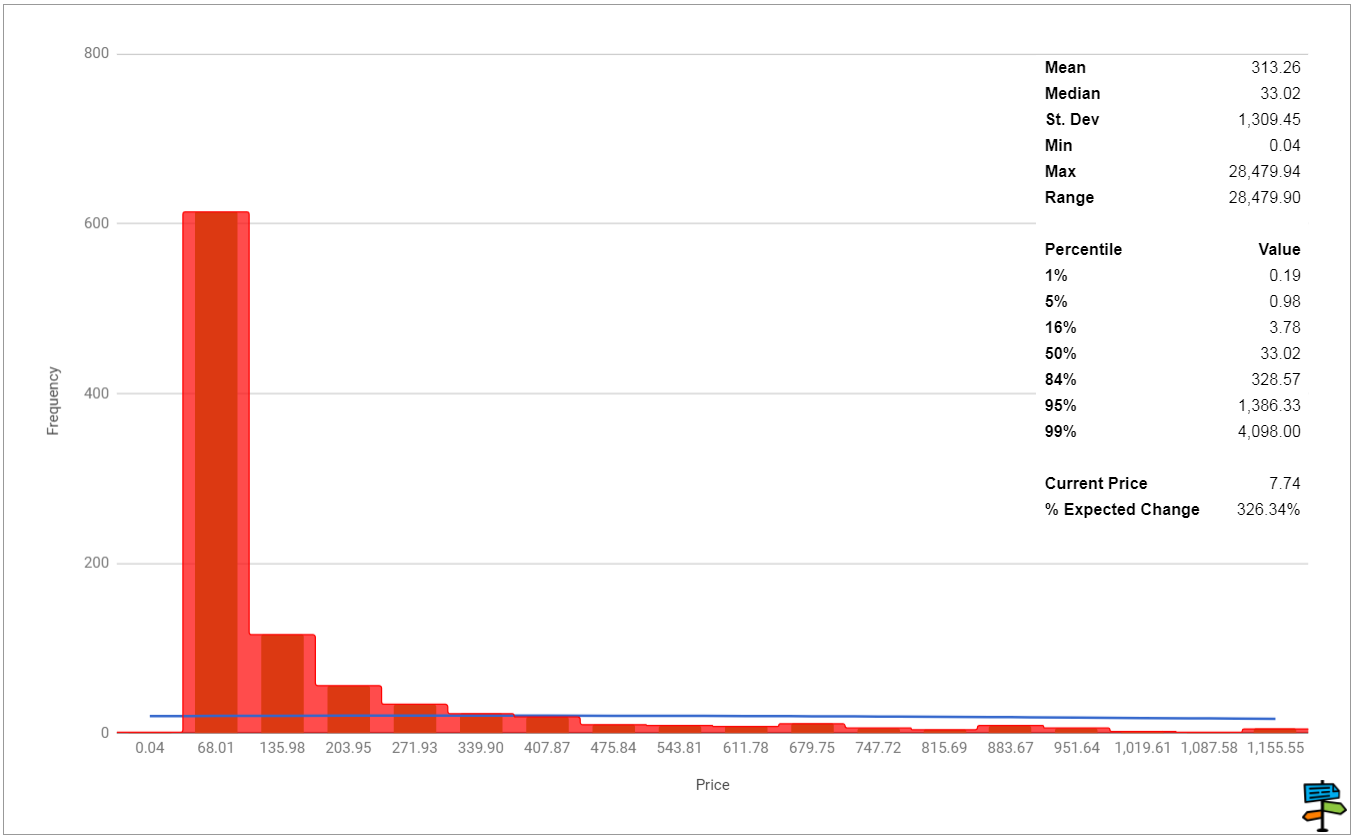 Verdict
We can be 95% certain that EOS prices will fall between $0.98, and $1,386 with a median of $33.
LITECOIN
What is Litecoin?
Litecoin’s claim to fame is faster transaction processing times. It uses a scrypt-based mining proof-of-work algorithm to target the regular computers and GPUs most people already have.
The ability to target regular computers and GPU’s happens to be a huge differentiator from the crowded mining population of Bitcoin.
One-Year Simulation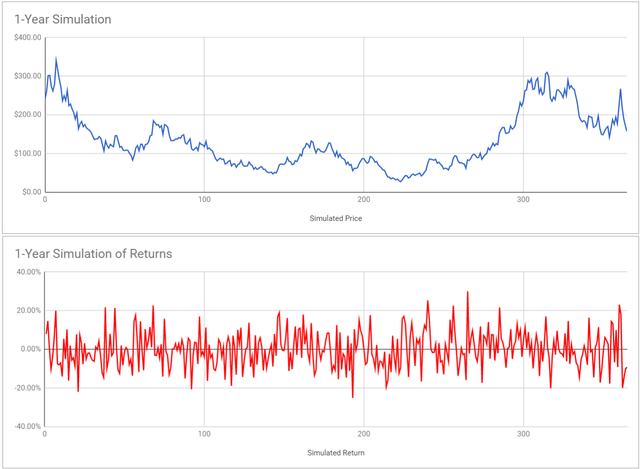
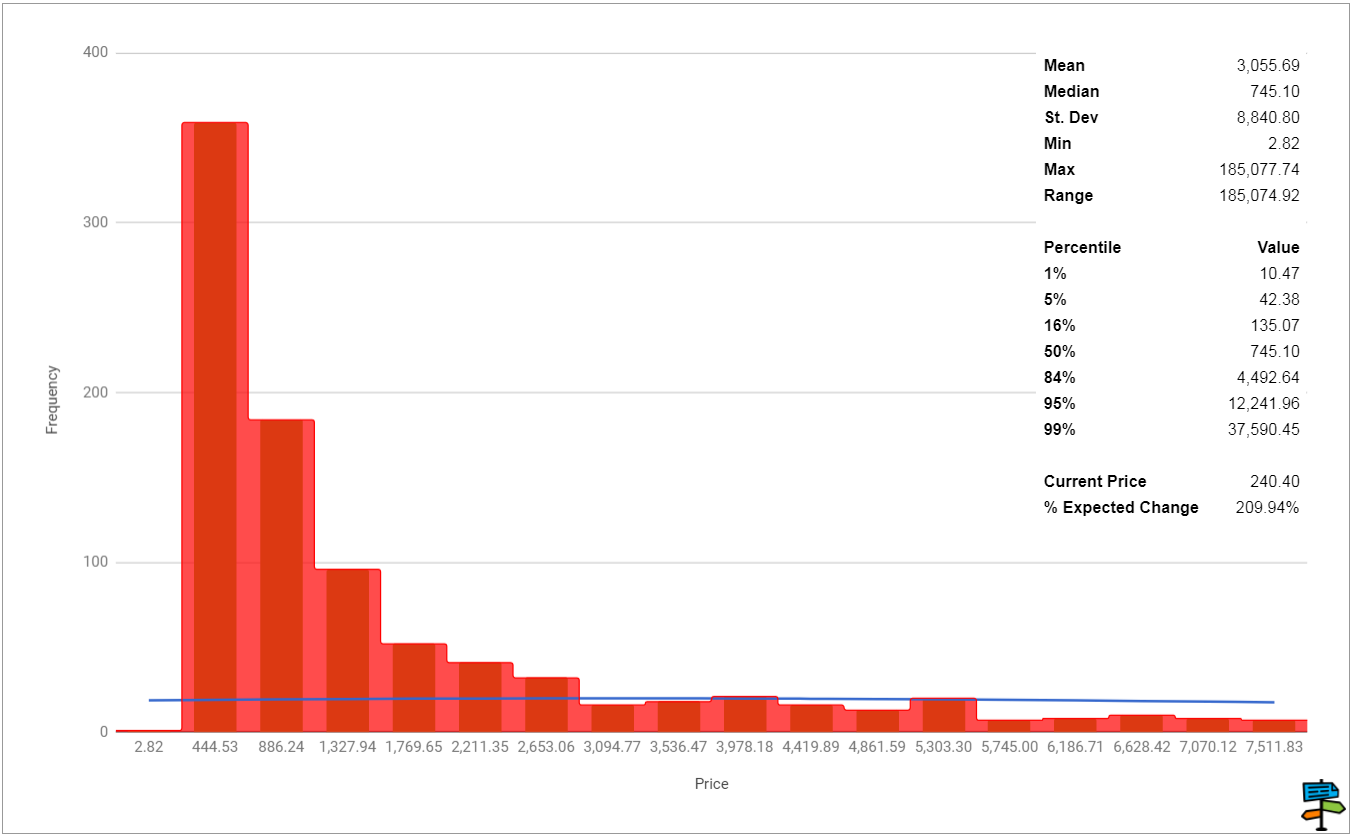
Verdict
We can be 95% certain that Litecoin prices will fall between $42, and $12,241 with a median of $745.
OMISEGO
What is OmiseGO?
OmiseGO is building a couple of things:
Decentralized exchange
Liquidity provider mechanism
Clearinghouse messaging network
Asset-backed blockchain gateway
OmiseGO is not owned by any single one party. Instead, it is an open distributed network of validators which enforce behavior of all participants.
According to Blocknight:
Also, OmiseGo counts Vitalik Buterin (Ethereum), and Joseph Poon (Lightning Network Co Author) among their advisers. Joseph Poon is actually billed as author of the OmiseGo whitepaper.
Those are some pretty big names.
One-Year Simulation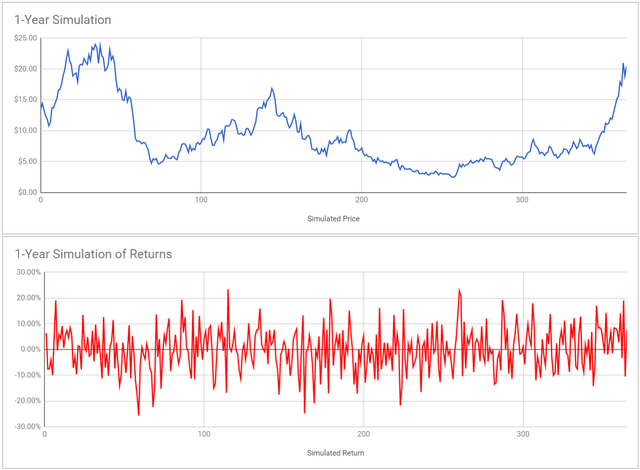
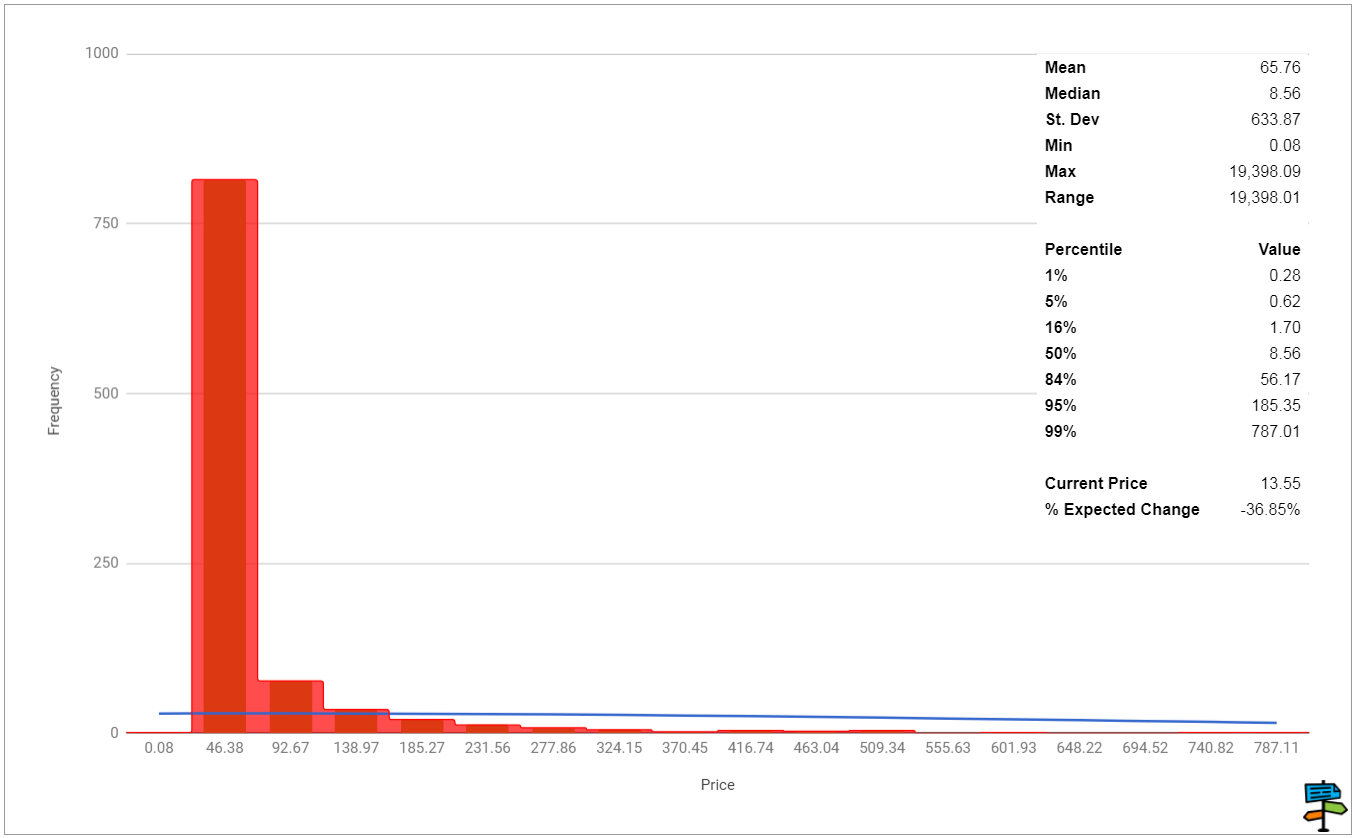
Verdict
We can be 95% certain that OmiseGO prices will fall between $0.62, and $185.35 with a median of $8.56.
NEO
What is NEO?
NEO (formerly known as AntShares) is a smart asset platform and the first open source public blockchain project in China. Smart assets are the combination of smart blockchain contracts and digital assets.
One-Year Simulation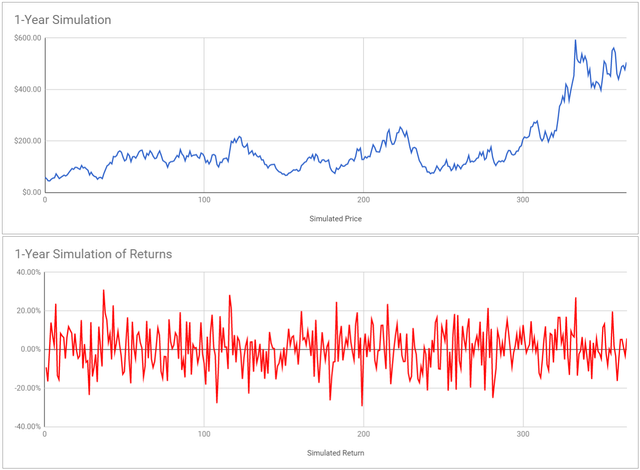
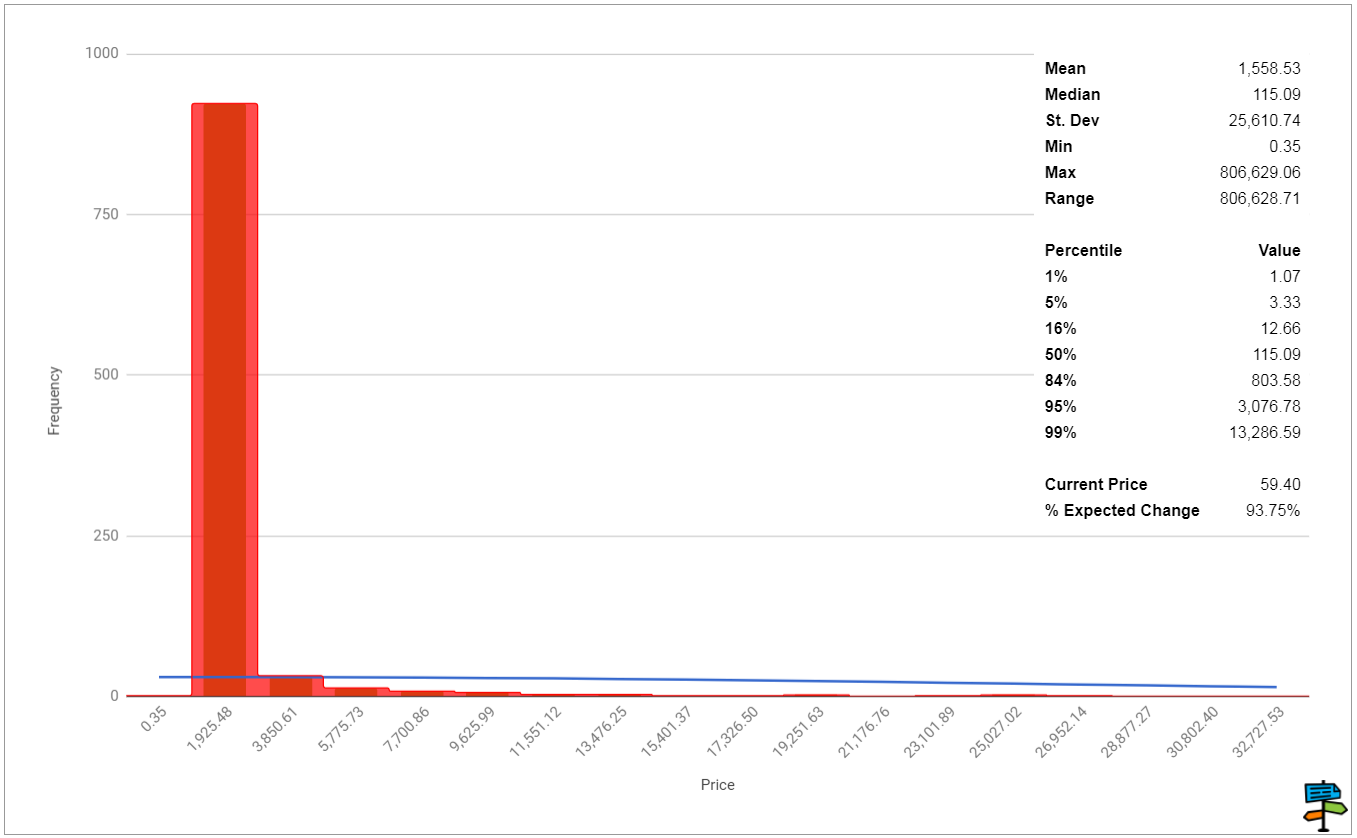
Verdict
We can be 95% certain that NEO prices will fall between $3, and $3,076 with a median of $115.
RIPPLE
What is Ripple?
Ripple is a system created for banks to enable immediate payments and lower costs.
The vision of the Ripple creators is to allow a bank transfer in a few seconds (instead of the horribly annoying 2–3 business days).
Of note, is that Ripple is a U.S. based company. From the xrphodor blog:
Ripple is a US-based company.
Why is this an important point to consider? A US-based company like Ripple is subject to some very stringent laws regarding securities trading and money transmission. These include requirements that define how Ripple might interact with crypto markets and both institutional and retail crypto traders.
One-Year Simulation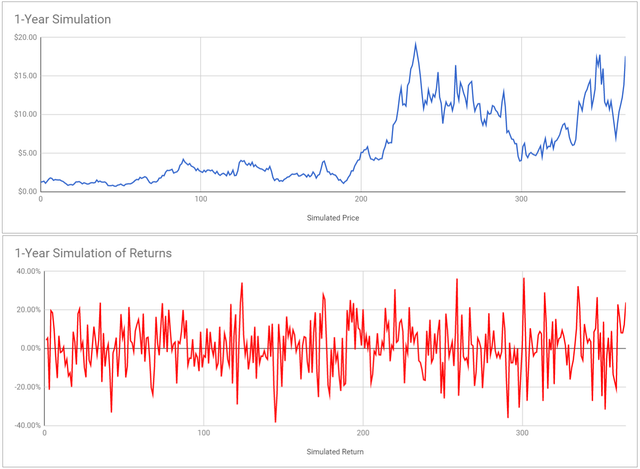
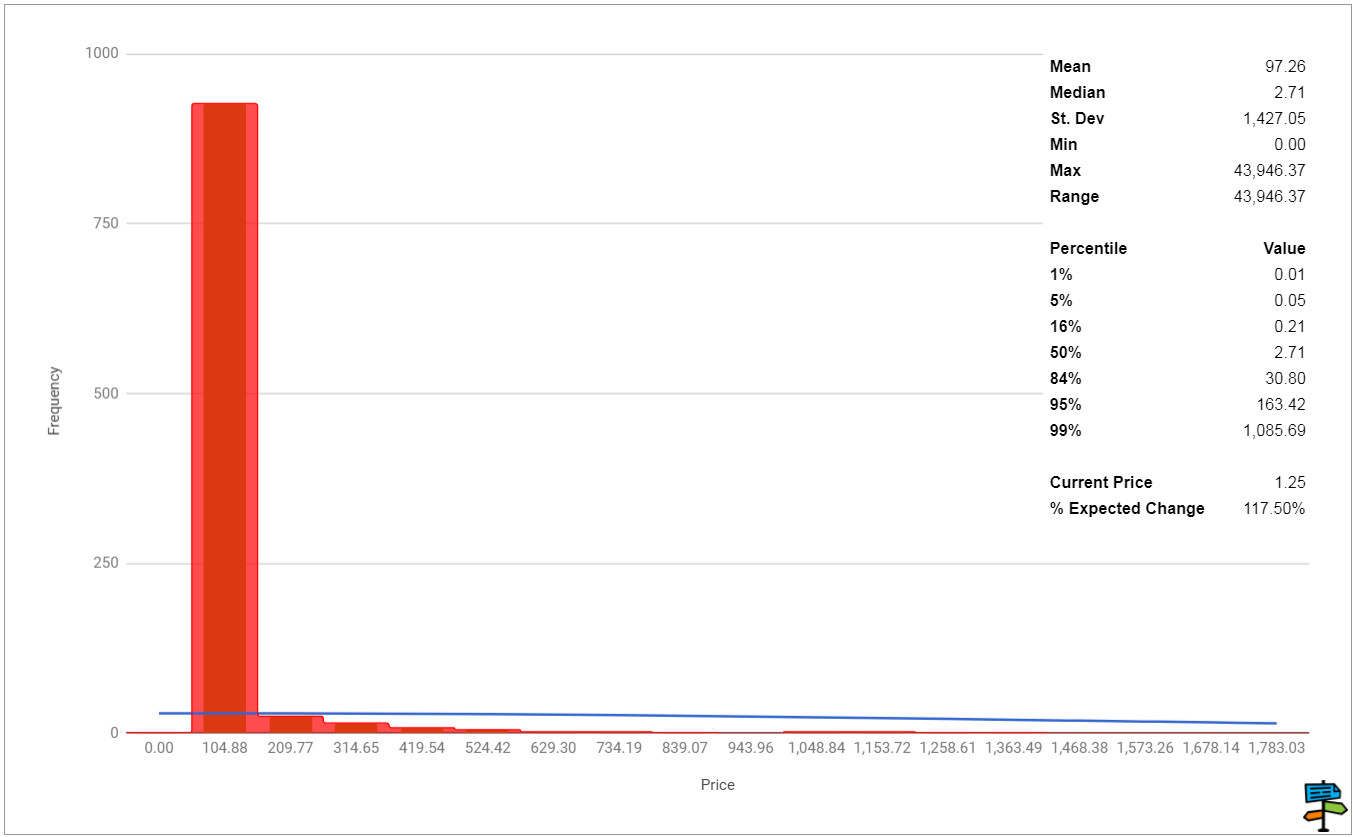
Verdict
We can be 95% certain that Ripple prices will fall between $0.05, and $163 with a median of $2.71.
MONERO
What is Monero?
Monero attempts to solve privacy and fungibility issues that persist in Bitcoin.
Part of the algorithm for Monero automatically mixes transactions with previous transactions and does this by implementing ring signatures.
One-Year Simulation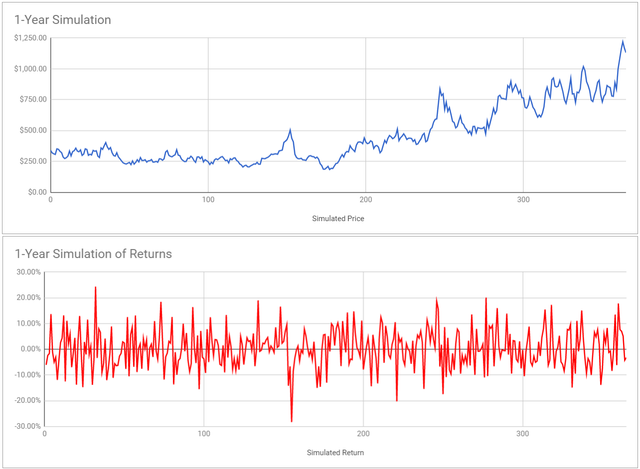
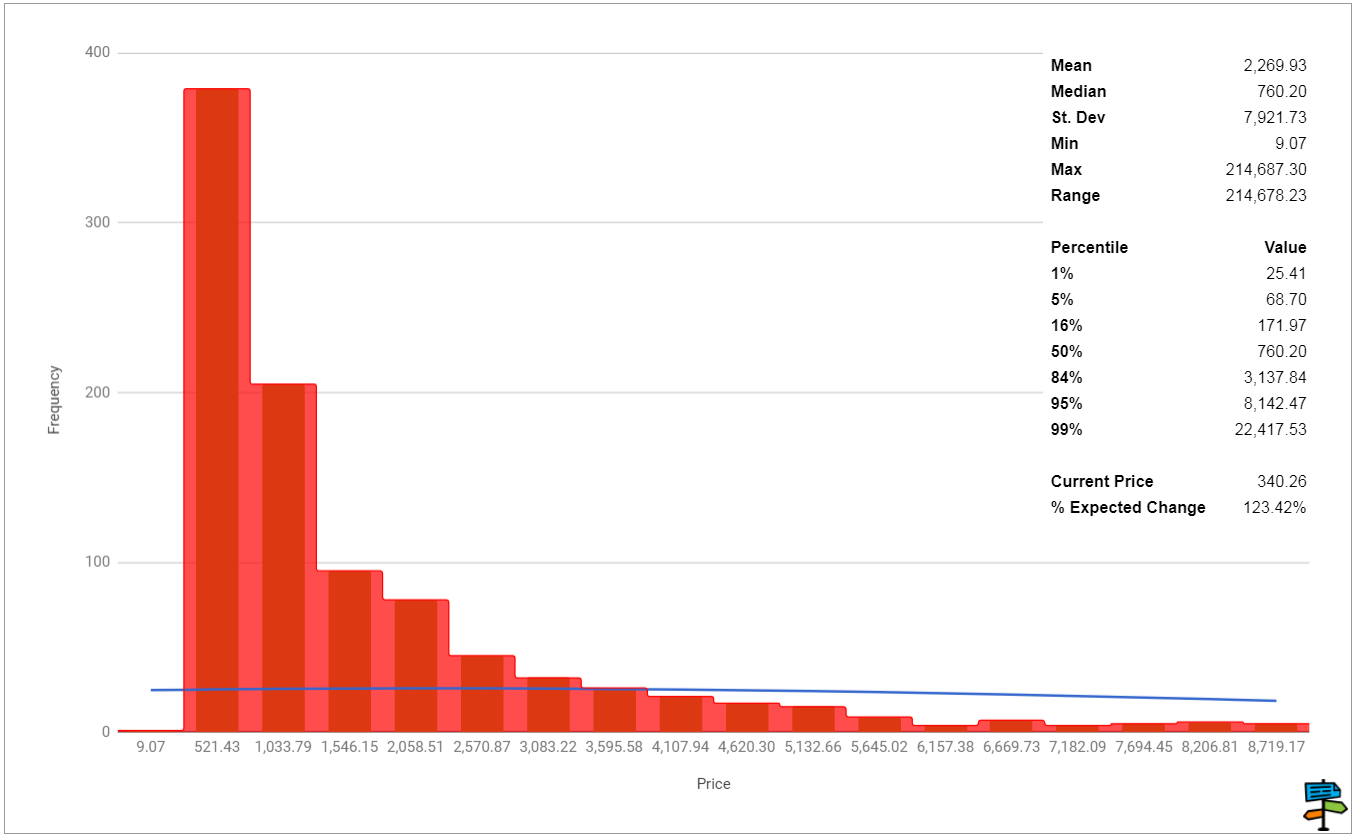
Verdict
We can be 95% certain that Monero prices will fall between $68, and $8,142 with a median of $760.
Zcash
What is Zcash?
From the Blockchainhub infographic:
Zcash is a permissionless cryptocurrency that can fully protect the privacy of transactions using zero-knowledge cryptography.
One-Year Simulation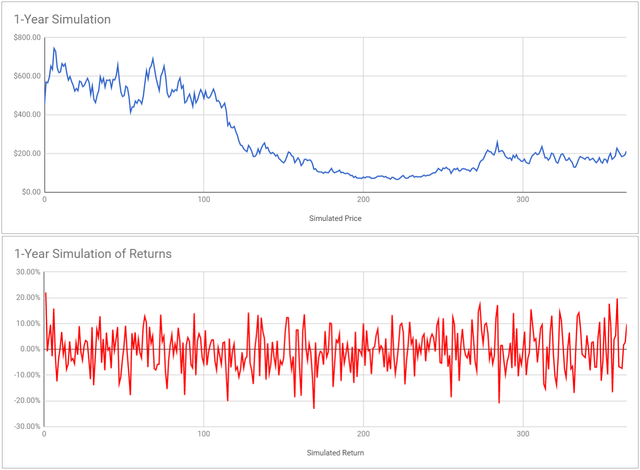
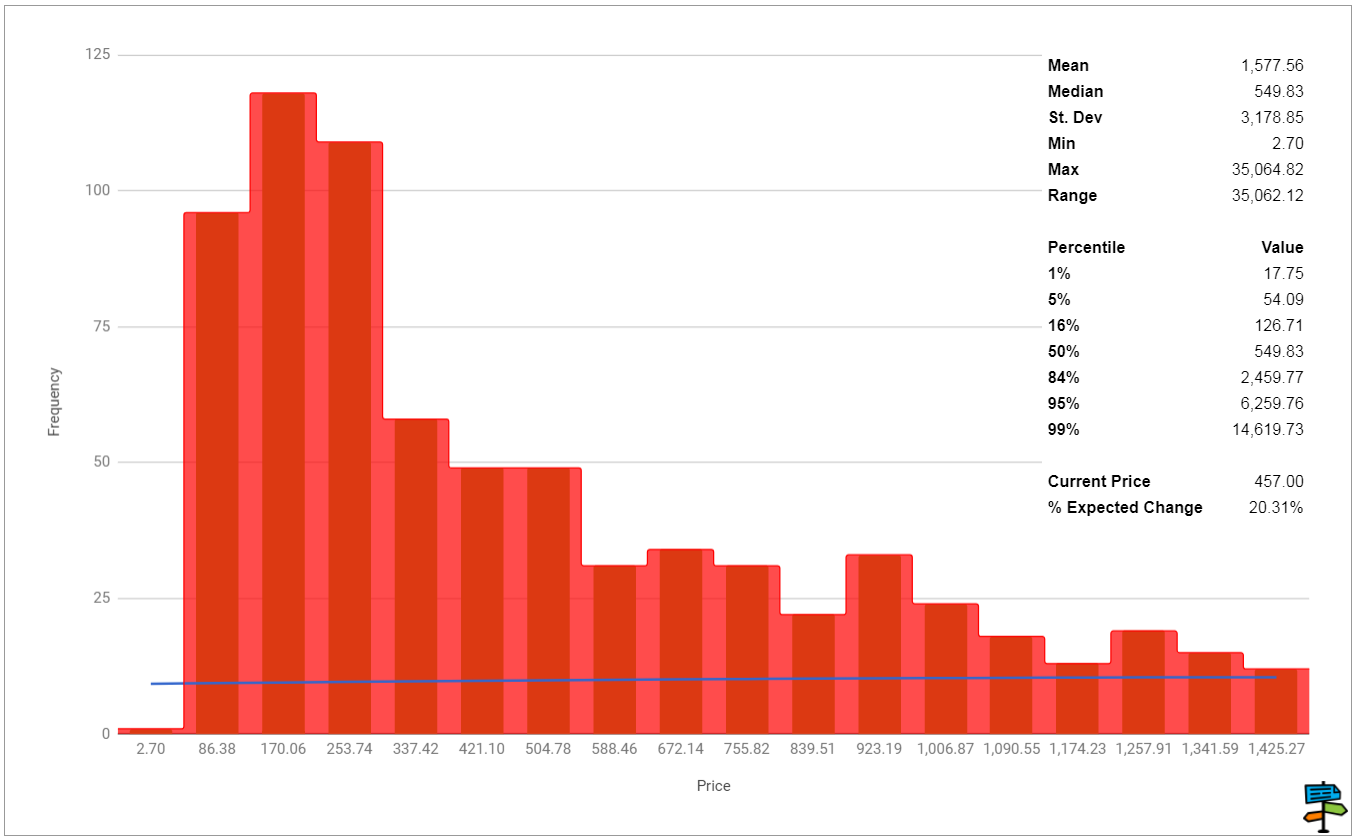
Verdict
We can be 95% certain that Zcash prices will fall between $54, and $6,259 with a median of $549.