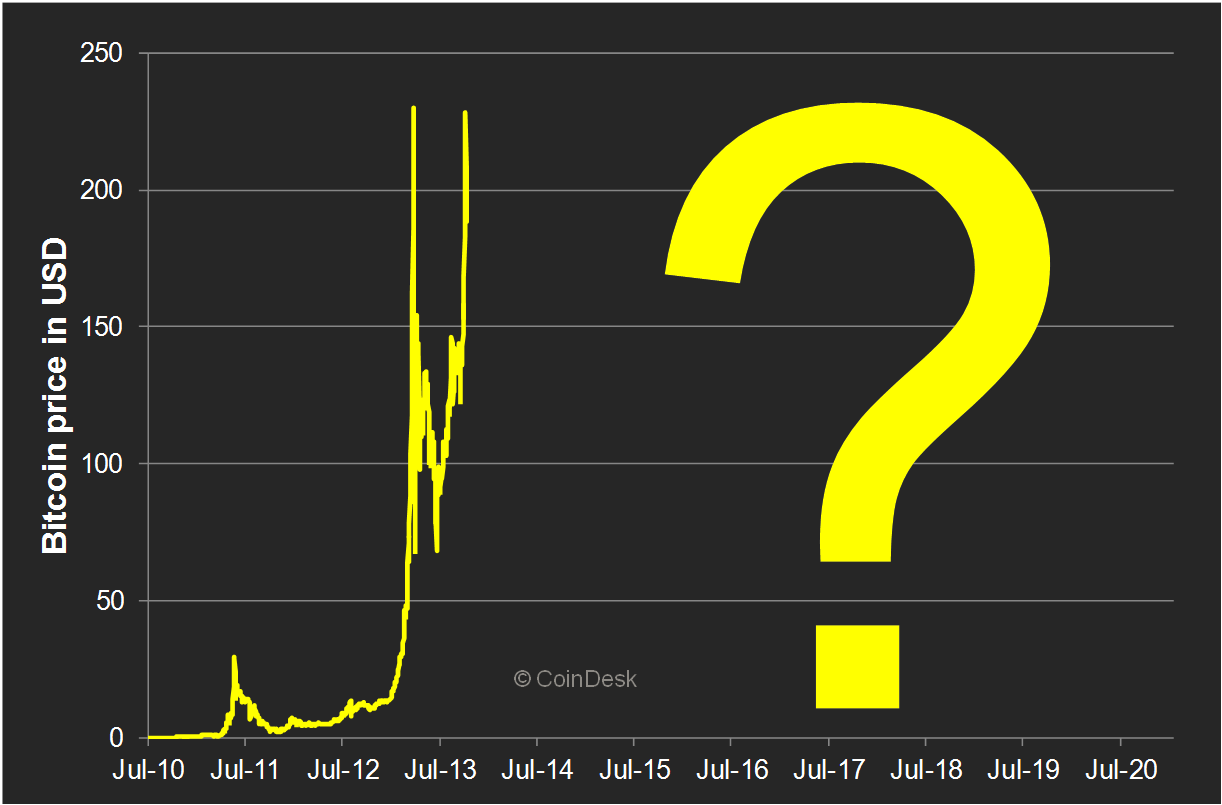
Method to calculate Bitcoins (Ƀ) next price move
It's true there is a way of finding Bitcoins price ahead
Crypto markets are breaking out to all-time highs. The total market cap of all crypto assets, which includes Bitcoin, now totals $165 billion, a 150 percent gain from mid-July lows of $67 billion and a whopping 16 times crypto’s value of $11 billion at this time last year.Bitcoin itself has reached another all-time high of $4,650, up about three percent in the past 24 hours, and many are wondering where it can go from there. Since cryptocurrencies carry a high degree of speculative value and very little fundamental value, technical analysis can offer a roadmap to future price moves. For this analysis, we can use trend-based Fibonacci extensions, using TradingView’s platform.
What are Fibonacci Extensions?
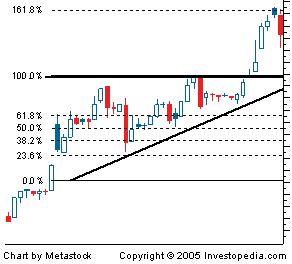
Fibonacci extensions are used in Fibonacci retracement to predict spaces of resistance and support in the market. These extensions involve all levels drawn past the basic 100% level; they are frequently used by traders to determine areas that will bring in profits. One popular extension, the 161.8% level, is used to set a price target on a breakout of an ascending triangle; this target is calculated by multiplying the vertical distance of the triangle by key Fibonacci ratio 61.8%, and then adding the result to the triangle’s upper resistance level.
Below you can see one popular extension-
It is best, and most practical, to calculate Fibonacci extensions when stocks are at new highs or new lows
So basically for FINDING THE PRICE there are three price points to consider in an uptrend: the former swing low, the most recent swing high and the most recent swing low. The Fibonacci Extension then plots future levels based on these three price points.
Here’s how they look applied to Bitcoin’s daily chart:

To draw this Fibonacci extension, we can began with the July swing lows at $1,850, then added the mid-August swing highs of $4,400. Finally, I connected the most recent swing low of $3,600. From there, I extended the Fibonacci lines horizontally to see where the next breakout might carry Bitcoin.
If the past can be any guidance to future moves, the Fibonacci extensions show overhead resistance at $4,937, $5,253, $5,703, and $6,275. While these shouldn’t be taken as exact price points, they suggest areas where the current rally might pause based on previous price movements. This is where traders long on Bitcoin should consider selling into strength.
Hope this will be helpful for all the investors out there.
Follow me: @ashishgore
Sources-
http://www.investopedia.com/terms/f/fibonacciextensions.asp
Image sources-
https://www.coindesk.com/bitcoin-price-long-term-potential/
http://www.investopedia.com/terms/f/fibonacciextensions.asp


nice post . carry on
Happy to post that can be helpful for others @taslimahmed KEEP READING
great post sir nice work done!!!followed you,if you are interested in health tips,please follow me at https://steemit.com/@billi007 (,please follow me
thanks for reading @billi007 Hope this will help you
Good stuff! Thanks for the info!
Thanks for the post...very informative. I followed you for your fib knowledge and look forward to other projections from you.
I think we will be in the $6000 range before a decent pullback comes.