Step By Step TA of BTC/USD
Hello,
This is my Technical analysis of BTC/USD.
I will show you, how I will position my bid according to the charting analysis.
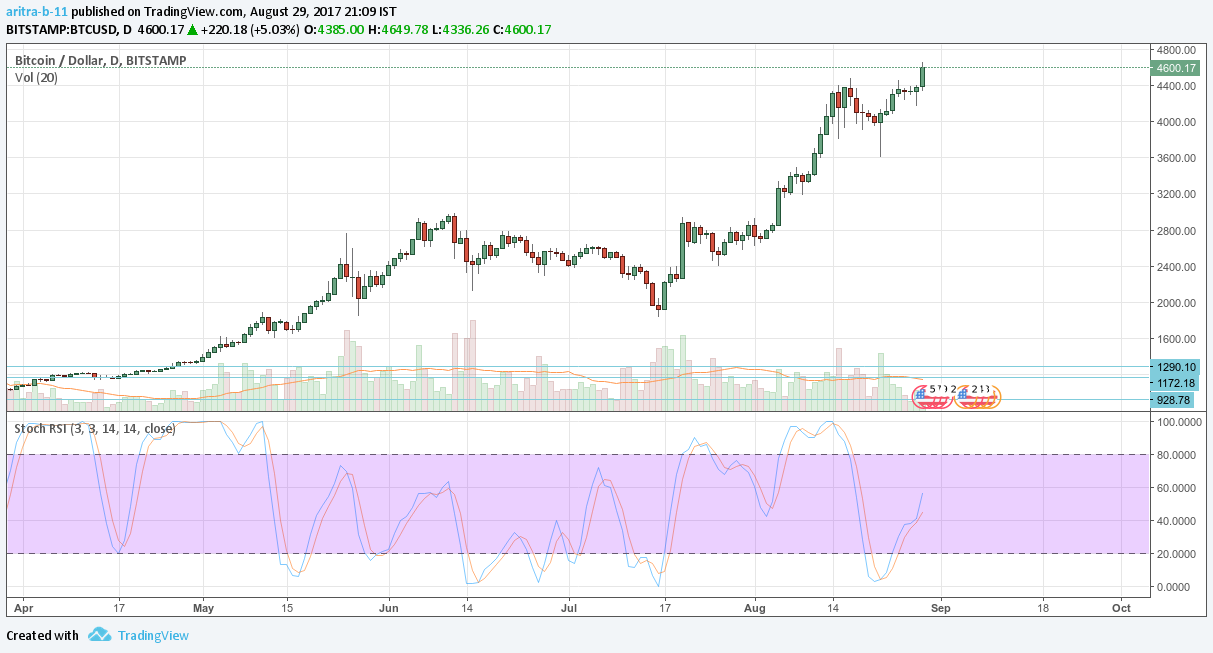
So first, open the BTC/USD chart with 1D interval. Use RSI indicator to see the over bought/sold conditions.

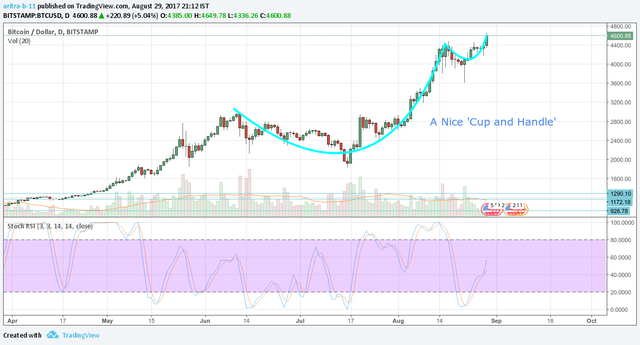
Next see the patterns. As we can see in the image given below, BTC/USD forms a nice Cup and Handle formation. This is a Bull movement indication!

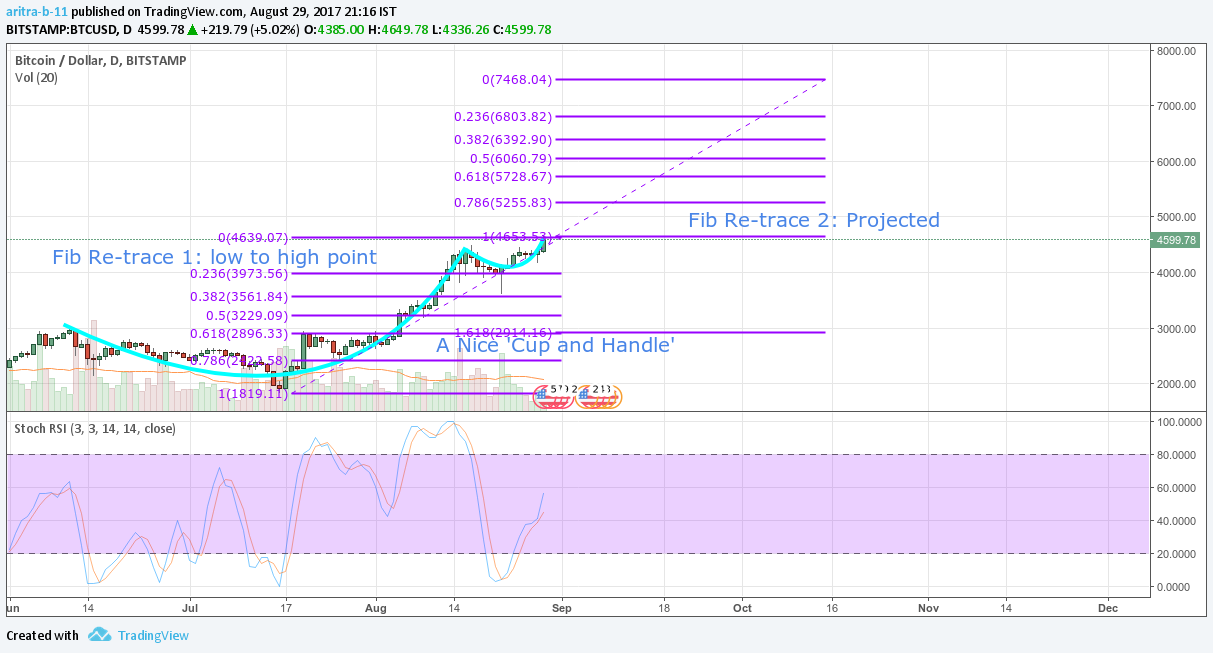
So, now that we have seen the bullish movement in the market, we will position ourselves to buy Bitcoin. For this, we will need a plan. The best way to do this, is use a Fibonacci Re-trace pattern. So, we will start by placing a low to high Fib line. The starting point will be the lowest shadow of the last trend candle. The End point will be the highest point of the wig of the present candle. Now copy this same Fib and place it on top of the current Fib. This gives us the present trend and projected trend.

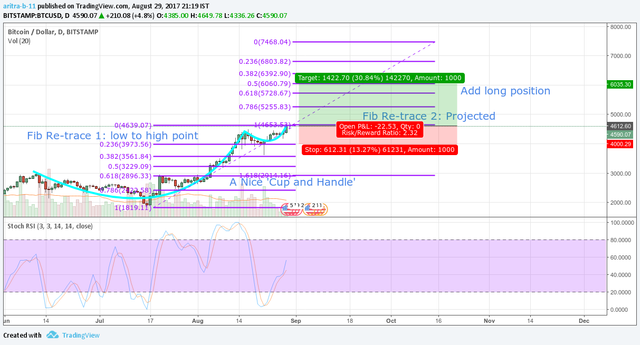
Next we will position ourself in the bid w.r.t. the market. For that I will place my long. It is better to have profit/loss ratio in between 2-3. I place my profit at 38.2% of projected and loss at 23.6% of current trend.

Finally, I will wait for my plan to fulfill. I will sell my BTC at $6035 and place my stop-loss at $4000.
So, did it help ? Let me know in the comments below.