BTC, how deep is this dip
Hello,
We are experiencing a major dip in prince of BTC for the past few days. There are a number of factors that may (or may not) have caused this:
- Reports on China's Ban on BTC exchanges can cause this panic sell,
- China's ICO regulation may cause the overall market cap to decrease, and recently,
- "Bitcoin is a fraud" by JPMorgan CEO, could make some newcomer to hold back.
Overall, there is a notion that, "This is the Bitcoin bubble burst".
First of all, Bitcoin is here to stay. It manged to overcome many road blocks in the past. Blockchain technology is a breakthrough in innovation. Bitcoin is its biggest testimonial. There are many smart people building fabulous technology around it, like ETHEREUM, RIPPLE, GOLEM, SIA, MAIDSAFE etc to name a few. Many of these (if not all) will become the new norm for the future. And so the Bitcoin.
To sum up, this is a market correction. It happens to all kinds of market. Similar to stock market in the 1920s, Cryptocurrency market, is just at its initial phase. Stock markets, saw the 1930s great depression, 2000s doc com bubble, 2008s housing bubble. It came back strong even after all these issues. Cryptocurrency market, will not be any different.
That being cleared up, lets get to the Technical Analysis of BTC/USD.
Price dip
Lets not be over enthusiastic about Bitcoin too. BTC/USD dropped by 35% from its peak. Do not believe, it is just going to the moon from here on. That is a possibility. However, the probability is, BTC will drop further. Here is why I think that.
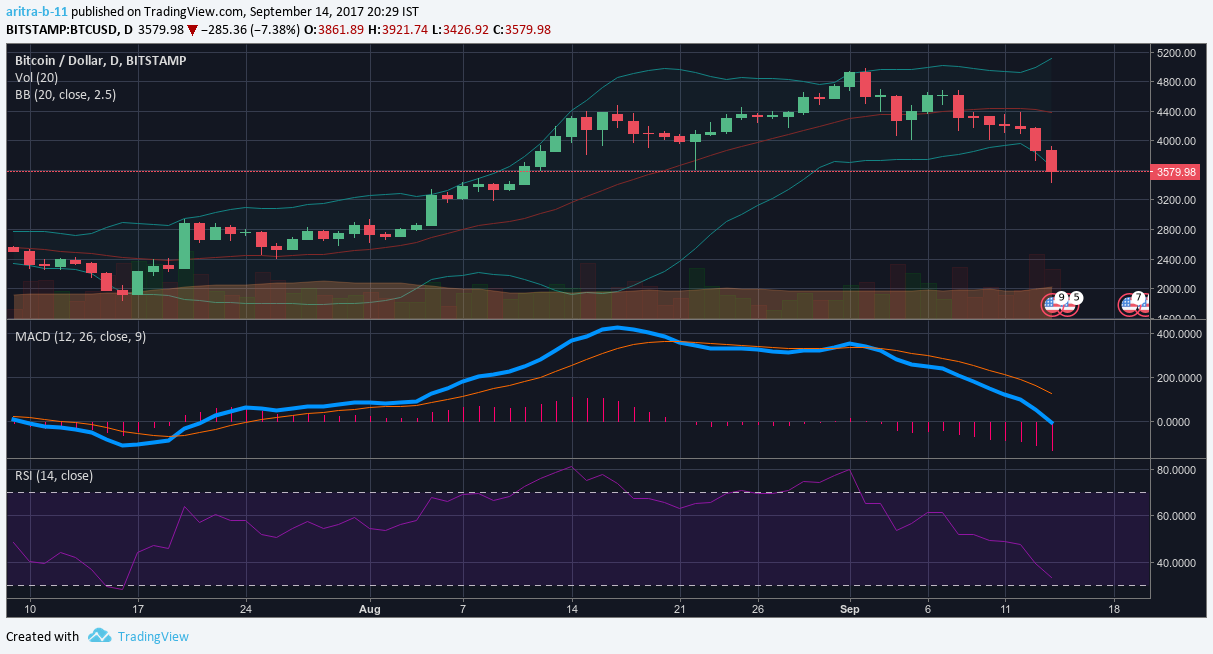
The above picture is a price action of BTC/USD. The top part is the "Bollinger Band" of the closing Price. In the middle, we have the MACD of the closing price. The bottom part is the RSI (Relative Strength Index) of the closing price.
Now, if you see the last part of this, in all 3 graphs, you will observe:
- The last Red Candle is below the lower level of Bollinger Band (top chart).
- The MACD line (blue in middle chart) is below the signal line (orange) and also below zero line of histogram
- RSI (purple line in bottom chart) is about to touch the 30%
All of these signals are bearish in nature. If the price line is going below the lower level of Bollinger Band, that confirms, it did not hold the last support level.
For MACD, if it goes under the signal level it confirms the bear signal. Moreover it has passed below zero level. So, bear market is likely to continue.
For RSI, nearly touching 30% mark, means market is nearly oversold. If it reaches below 30%, it can continue for some time.
In conclusion, this is the first major bear market in BTC. Right now, it is better to keep and eye on the price and wait for the perfect time to buy.
We have not reached the full depth of the dip yet. For that, wait for a few more days.
Someone should post about how cryptocurrencies could become more stable. These huge swings are unacceptable and it each swing damages all market...
I could not agree with you more on this, a stable currency is a reflection of a stable ecosystem. I think, when Bitcoin gets adopted as a global money, then we will see more people working on stabilizing it. As of now, since all cryptocurrency is measured w.r.t. USD, it is very difficult to try that now. Instead, effort is better utilized for lowering mining cost, mass adoption, large transaction capability with shorted wait time & lower fee.
Congratulations @aritra! You have completed some achievement on Steemit and have been rewarded with new badge(s) :
Click on any badge to view your own Board of Honor on SteemitBoard.
For more information about SteemitBoard, click here
If you no longer want to receive notifications, reply to this comment with the word
STOP