RE: Bitcoin’s Whiplash Bear Trap
Some additional reasons to expect Bitcoin to start rising again soon...
Every December since 2015, Bitcoin has experienced a significant “Santa Claus” price rally:
https://cointelegraph.com/news/bitcoin-moves-30-in-december-since-2015-will-2019-be-different
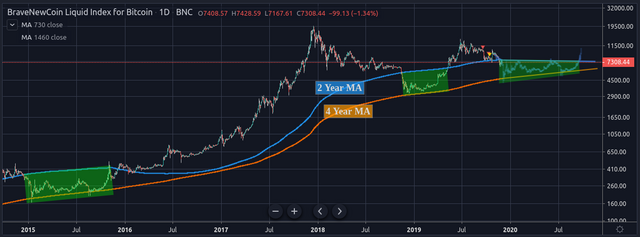
The correct interpretation of the following chart indicates that the current juncture corresponds to early 2016 (although I argue that the coming moonshot will be accelerated compared to 2016 – 2017). The author of that chart doesn’t seem to realize that the accumulation zone already occurred at the start of 2019 as shown. Also if his future scenario occurred, then he drew the blue line’s future incorrectly because it would dip lower, thus invalidating his assumed pattern.
(click to zoom to live source for updates)$20,000Bitcoin is now months overdue and thus likely imminent with the Tether market cap having been over 4 million for 4 months:. @filb filb wrote in Current Tether Supply Suggests Bitcoin Price Is Correcting to $20,000:[…] FilbFilb’s notes that there is an approximately 32-day delay between Tether and Bitcoin’s price action.
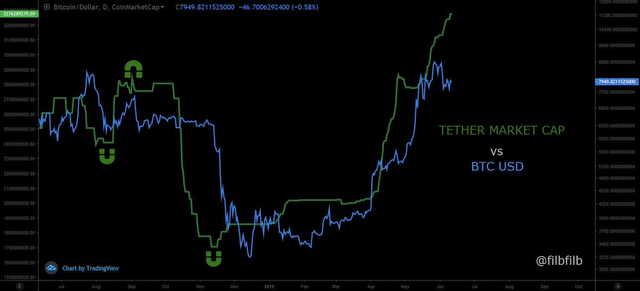
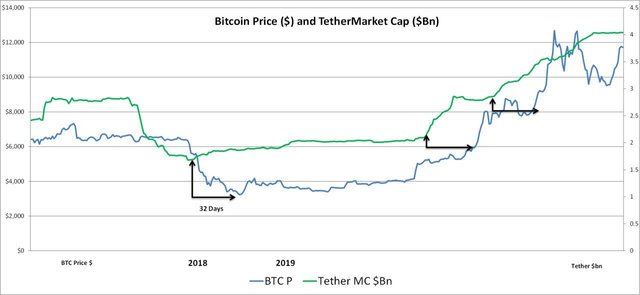
(click to zoom)@filb filb has identified in Bitcoin Price Showing Hidden Signs of Reversing — Next Target $8.2K increasing bullish divergences compared to two weeks early in Bitcoin Price: Strong Bounce at $6.5K Enough for a Bullish U-Turn?, and noted that the next and last line of bullish defense at the 200 WMA around
$5400would be unprecedented at this stage after the end of the cryptowinter cycle: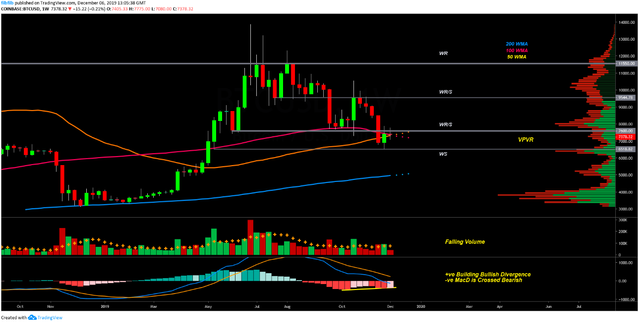
(click to zoom)The 50 and 100-week moving average (WMA) are in the process of crossing bullish which has only occurred a few times in Bitcoin’s history and has signaled an impending upside move […]
The 200-WMA is situated in the
$5,000range where there is also some historic volume interest at this price range. Many analysts are calling for a retest of the 200-WMA which would likely be a last line of defense for bulls. This would also be unprecedented at this stage in the Bitcoin market cycle.Generally, volume on spot exchanges has been decreasing through the circa six-month decline which is typically a sign of sellers becoming exhausted as each push lower entices fewer participants to sell.
The moving average convergence divergence (MACD) has crossed the zero line to the bearish side, meaning that the underlying moving averages are now crossed bearishly. However, there is a higher low forming on the histogram which is an unconfirmed bullish divergence.
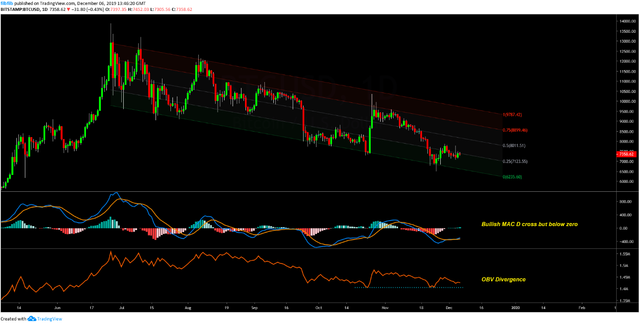
(click to zoom)The outcome is normally an explosive move up or a retest of the bottom of the channel. The 50% retracement of the channel is currently at
$8,200and would represent a reasonable breakout target. A retest of the channel could possibly occur at$6,500.The MACD histogram shows that there is bullish divergence forming and the MACD line itself has crossed bullish and plotted a higher low which is also a sign of bullish divergence.
The on-balance volume indicator (OBV), a tool that is demonstrative of the directional strength of cumulative volume, also shows a bullish divergence which is concurrent with the decreasing volume on the weekly chart. The OBV is however still trending down and a break out may imply a turn in the market.