STEEM/BTC to cross 0.001 - Market report for this week!

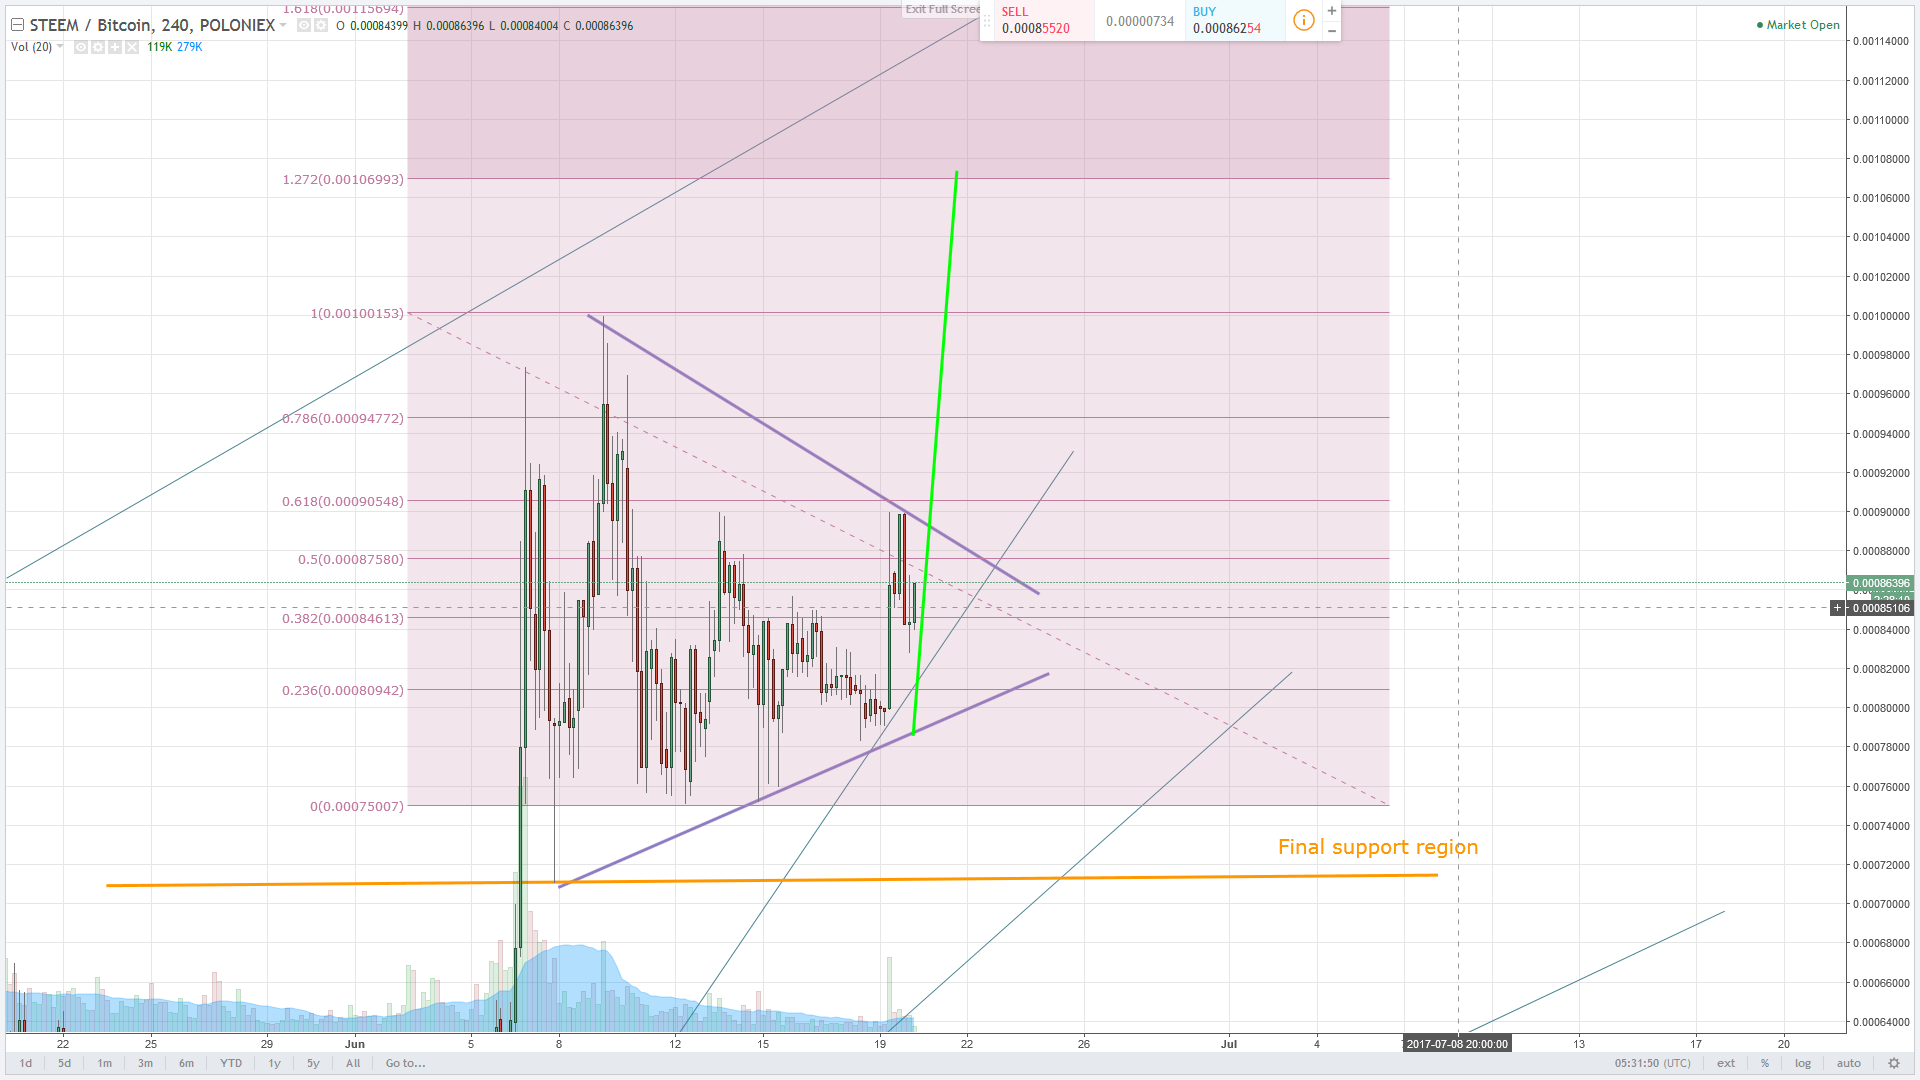
Steem BTC is at its final wave in the triangle before a possible break higher above 0.001 region.
That is a also a fibonacci extention area at the 1.272 region, expecting a pullback when price reaches that level
Overall trend for Steembtc is still bullish until the final support region breaks.
We are expecting a further high than the 1.272 region, for a triangle pattern, the hight of the triangle can be added to the point where breakout occurs to find the true take profit region.
Therefore an oppotunity to be will still be available if you haven't bought any steem.
A remark to steemians new to trading,
The chart can be read as 1 Steem to Btc value, as the chart moves up, it can mean 2 scenarios, strength in Steem or weakness in BTC.
Although I have not plot waves in the chart to show you visually, I did it in the background, conclusion being: final wave before the triangle breakout.
NEWS UPDATE
Crytocurrency posing as China's central bank
Crytocurrency are posing as People's bank of China to fraud investors.
Litecoin tops $50
New all term high by LTC!
Bitcoin miners unite behind Segwit2x
Basically it is a scaling solution to increase the network transaction capacity!
Usual Disclaimer
Dear steemians,
I will like to share more indepth details on how to use certain indicators, ie fibonacci ,elliot waves and many more. I appreciate it if you geniunely want to learn that, comment and let me know, if there are enough attention for that content, I will most definetely share.
For my steemians that are new here, I chart and update possible scenarios. Anyone telling you they can chart once and that will happen definetely, you have to link me to him/her. Over the years, charts to me are constantly updated as price action forms new scenarios etc, if you are trading on my chart and expecting guarantees, you will be disappointed for sure. "Triangle formed yesterday cound most definetely become a rectangle today" But I will always point out the highest probability scenario to you.
*I am not a guru...
*These chart and infomations provided are my personal view and ideas on the market, use it at your own risk.
*Trading is risky business. You and only you are responsible for your trades. Do trade with caution.
*Trade with money you can afford to lose, not the money you and your family needs to survive on.
*Trading is all about consistancy, there is no holy grail that takes you straight to heaven.(let me know if you have found one)
PS:
Follow me if you like my analysis.
Comment to discuss or what pairs you will like me to chart
Resteem if you would like to help me gain followers
Upvote? If you want to toss me a penny
The more people we have following my post, the more detailed my analysis will get and more discussions can be formed.
Do you typically chart STEEM/BTC? I find it more difficult to keep track of prices and like to do STEEM/USD - plus it makes bookkeeping so much easier.
Granted, tradingview doesn't have the USD chart for STEEM, but it would seem to me that it'd be 2x as hard to forecast when both STEEM and BTC prices fluctuate. Like you said, the charts could mean movement in either. Thoughts?
lookin forward! :D
ATH was $55 a while ago.
Great post @amazonpricecheck! Loving it all. Nice to have steemians like you on steemit. Just so know... deep down, I believe you will do great things. This is only the beginning, I believe in you!
We can be best buddies. Good news, I shared your post and followed you, follow me back to share the excitement!
Have fun!
Congratulations @amazonpricecheck! You have completed some achievement on Steemit and have been rewarded with new badge(s) :
Click on any badge to view your own Board of Honnor on SteemitBoard.
For more information about SteemitBoard, click here
If you no longer want to receive notifications, reply to this comment with the word
STOPBy upvoting this notification, you can help all Steemit users. Learn how here!