Bitcoin Price Technical Analysis 21-2-2018
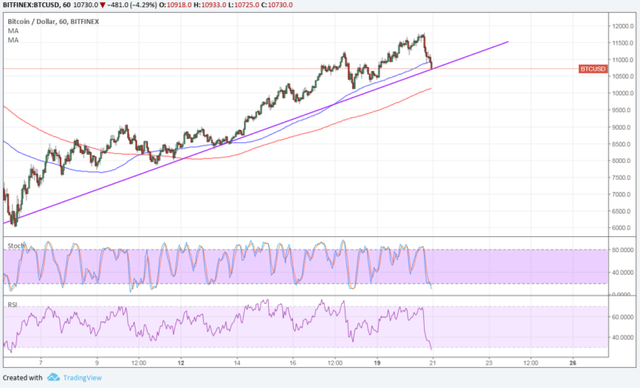
After a strong rally from the $6,000s, bitcoin ultimately saw a near 100% growth in market value as it now sits atop its rally in the low $11,000s. Bitcoin price is pulling back from its uptrend and is testing support at an area of interest where buy orders might be located.
Bitcoin price sold off from its rising wedge support previously highlighted, signaling that a downtrend may be in order. Price is still testing support at the rising trend line since the start of the month.Technical indicators are also suggesting that bullish momentum could return.
The 100 SMA is still above the longer-term 200 SMA to confirm that the path of least resistance is to the upside.the 100 SMA lines up with the trend line to add to its strength as a floor.
Similarly RSI is in the oversold region to signal that sellers are starting to get exhausted.
Turning back up could draw bullish pressure back in and allow bitcoin price to bounce.
The US dollar extended its gains to its counterparts even as US traders returned from the holiday.
Today the FOMC minutes are up for release and hawkish remarks could spur tightening expectations, which might even be more bullish for the dollar.
DISCLAIMERS:
THIS ARTICLE IS NARRATED FROM NEWSBTC.COM . This #article should not be taken as, and is not intended to provide, #investment #advice. Please conduct your own thorough research before#investing in any #cryptocurrency.
SOURCE:https://www.newsbtc.com/2018/02/21/bitcoin-price-technical-analysis-02-21-2018-waiting-buyers/
ORIGINALY SHARED: https://steemit.com/bitcoin/@alirajput/bitcoin-price-technical-analysis


You got a 50.00% upvote from @yourwhale courtesy of @alirajput!