RSI INDEX ! INVEST SMARTER 1 - UNDERSTANDING market indicators to help you better interpret the CRYPTOCURRENCY Markets! – Practical Guide !
"An investment in knowledge pays the best interest “~ Benjamin Franklin
Intro:
Hello everyone. This will be the first post of many to come regrading reading market indices and how to use it to help you better understand the market movement and help you make better investment choices. I have a knowledge regrading market Indices as I was an Algorithmic Trading researcher at the Quantopian platform for automated trading using Python. And a lot of my research involved the use of numerous market indicators.
I believe it is my moral obligation as a human being to share my knowledge and likewise for you to enlighten others with your knowledge and experiences.
Overview:
I will be using cryptowatch (https://cryptowat.ch) exchange graphs for BTC/USD as an example when I am explaining
It is very important to understand that there are many factors that can influence the price of a currency or stock. Some of which are quantified such as market cap, supply, demand, spread and so on, and others aren’t quantified such as news or hype. Stock/Currency indicators helps us better understand market movements and price trends as the indicator itself has a meaning that you and I can understand (ex. Overbought, oversold, undervalued, etc..)
A) WHAT IS AN RSI INDEX?
In short: The RSI Index stands for Relative Strength Index. This index identifies if an asset/currency (ex. BTC) is overbought or oversold. Or in other words, if that asset is undervalued or overvalued.
Investors use this index as a BUY or SELL signal. I will explain how to do this later….
The RSI index is a number between 0 and 100.
IF the (RSI index > 65) then currency is overbought and therefore the PRICE will DROP
IF the (RSI index < 35) then currency is oversold and therefore the PRICE will RISE
(note: if you research the RSI index online, you will notice that they use the 80-20 rule/limit instead of the 65-35. The 80-20 rule works great with stocks, however, I have been getting consistent results by using the 65-35)
B) How to practically use the RSI Index?
First lets setup our cryptowatch interface.
- Go to : https://cryptowat.ch/bitfinex/btcusd
- On the top right corner of the graph, select the Settings icon and copy my confutation that is in the screenshot below:
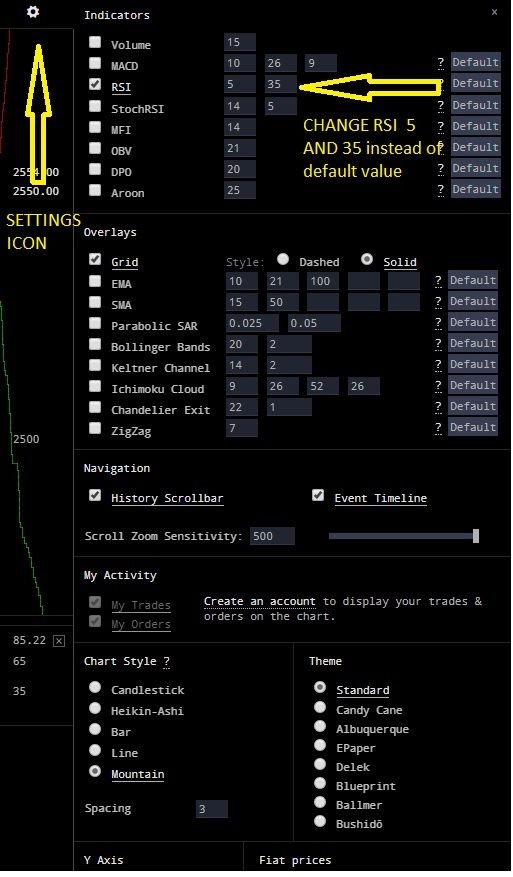

Your screen will look like this :

C) Analysis:
Below is a screenshot of the Bitfinex exchange using cryptowatch - ( date: 06/18 time : from 12 am till 4 am)
(use this link to see the full resolution picture):
https://drive.google.com/open?id=0B3G7XMdRDafvdDhmT0QtSW56ak0

Area A (RSI < 35): At 00:00 RSI index is decreasing and so is the price till it reaches point A1
- Point A1: notice how the RSI index is decreasing till it reaches point A1 and then the Index starts increasing again
This means that the currency reached the limit at and the currency is too undervalued and therefore more people will want to purchase the currency at this low(relatively) price and in turn the price will go up until it is too overvalued.
Area B (RSI < 35): At the start of Area B, the RSI index just went below the 35 limit and as you can see the price of the bitcoin took a steep drop till point B1.
- Point B1: notice the RSI index at point B1 starting increasing and consequently the price of the bitcoin started rising because
it is too undervalued.
Area C (RSI > 65): At the start of Area C the RSI index just passed 65 and as you can see the BTC price is increasing as well till point C1.
- Point C1: notice how the RSI index started decreasing and so does the BTC price – here the BTC is considered to be too
overvalued and therefore people will sell and consequently, the price will go down
Area D (RS1 > 65): At the start of Area C the RSI index just passed 65 and the BTC price is increasing till point D1.
- Point D1: at point D1 the RSI index starts to decrease and consequently the price of the bitcoin
I hope you guys learned something and that its clear for you how the RSI index can be used as a BUY or SELL signal. Please feel free to ask any questions about the RSI index in the comments.
If I see that many people are interested, then I will continue on and make another story about MCAD market indicator! with real examples!
If you would like me to make stories showing how to calculate real-time RSI or any market indicator for BTC exchanges using python then make sure to mention it in the comments!
Thanks and have a great day :)
Great idea, if it works. In my post on what a reputable trading system is:
http://stocklocater.com/find-reputable-trading-system/
I would love to see how your signals stack up.
Do you have backtesting results for the last 10 years following the signals you just posted? Please post, I would love to see them.
Does the return average 33% annually over the last 10 years?
What is the drawdown? This measures the risk and is important number.
If there is some way I can get the RSI numbers for the last 10 years? I could write an app and test if your theory works if you don't have the numbers or proof.
I write a blog at StockLocater.com and test trading strategies and the ones that work go on my site and get a positive review and a link back to your post here.
Here are the returns of a trading strategy that locates overbought and oversold markets (like yours does) and uses TNA and TZA to cash in on it. This strategy was able to take $10k and turn into $1 million within 4 years. Would love to see your results in a format similar to this strategies results: https://stocklocater.com/its/tools/pastpicks.php
Edit, deleted comment
Resteemed this post.. This is something extremely useful and extremely well put. I think many people who are just starting in cryptos should read this. Wonderful work, looking forward to seeing what you put out next!
I d certainly be interested to read more of this,
even though i already use RSI in my analysis i got a much better grip of what it really is and what it shows exactly.
Amazing post. must read.. Please keep posting more articles.. thanks for helping the community..
will do !!
Great articles with clear explanation so far
Thanks for the great content! It's rare to see such a detailed guideline on using RSI for trading Crypto.
I hope you well and looking forward for more incoming posts!
Might I have a newbie question, sir?
So the using of 65-35 works out for you I figure.
Because I like to trade different alt coin pairs charts. I'm thinking of trying to adjust them so that It will yield the correct result in the history if they are not already are for the particular coin pair I'm looking at.
Do you think it's a good practice to readjust this parameter depending on each chart?