Ethereum Price Weekly Analysis – ETH/USD To Surge Higher?
Ethereum Price Support
Recently, the price has been corrected to the downside and traded below the 23.6% Fib Fib retracement level from the lowest level at 418.50 to the $ 530.62 level. However, the bearish movement was limited by the support area of $ 480-485. Moreover, the 38.2% Fib Fib retracement level from the low of 418.50 to the $ 530.62 level was also supportive. On the downside, there is also a new major ascending trend line formed with support at $ 460 on the 4 hour chart from ETH / USD. Thus, the pair is well supported above the $ 460 level and the 100 SMA (4 hours).
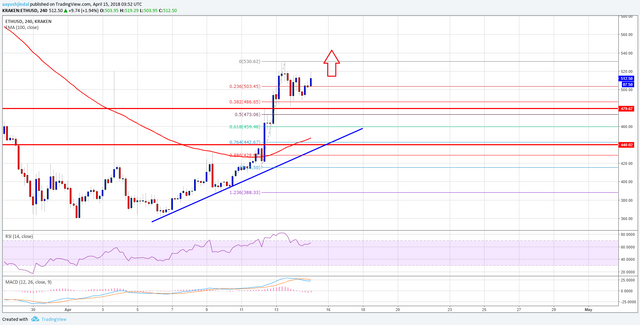
The above chart indicates that as long as the price is above $ 460, it is still bullish. On the upside, the price should break the last high of $ 530 to start a new bullish wave. The following obstacles on the upper side above $ 530 are approaching the $ 575 level.
MACD Index Over 4 Hours - MACD is currently showing positive signs.
RSI - RSI - 4 hours - RSI is currently higher than the 60 level.
Basic Support Area 460$
Basic resistance area 530$


Hi @ali11. Could see ETH hit $550 very soon.
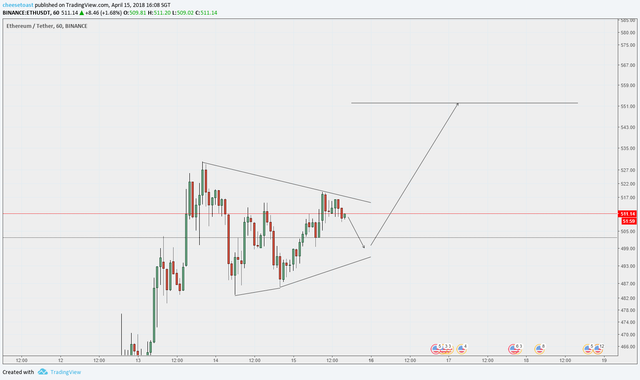
Break-out pattern forming, keep an eye on it.
This post has received a 0.94 % upvote from @booster thanks to: @ali11.
welcome and congratulations on making your post! I gave you a vote! If you would be so kind to give me a follow in return that would be awesome! and please give me an up vote.