Bitcoin Weekly Chart Analysis: Beware

Last time I mentioned how my perspective had changed somewhat from bearish to neutral, but that I am also very wary of a bull trap. In recent months, strong support has been created at the level of $6,000 and in the past few weeks Bitcoin's price has slowly but surely been making higher and higher lows. This is a positive development, but at the same time we see time and time again that Bitcoin's price is having trouble breaking critical resistant levels and that the volume quickly dries up after a (short) rally. The graph shows it: the market wants to go up so badly but is also scared.
The weekly and monthly graph illustrates this wonderfully.
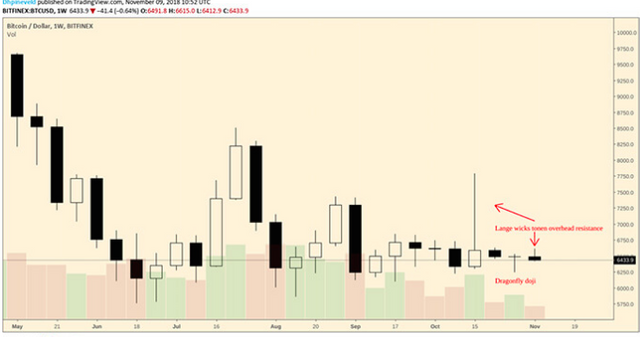
Figure 1 shows the weekly graph of Bitcoin. This graph shows how Bitcoin recently found support at the level of $6,000 and also made higher lows. This technical picture is one of the reasons for the optimism in the market about a possible bull run. To make it even more beautiful, we closed with a dragonfly doji last week. The dragonfly doji is generally a good signal for a possible trend reversal, especially when this doji forms at a strong support level as in this case. The dragonfly doji shows that the bulls at that level are in control.
No matter how good this sounds, this is only one side of the story. On the other hand, we also see that the overhead resistance is large. In other words: traders sell their Bitcoins at the first best opportunity on a (relatively) good return. This overhead resistance is clearly visible in the long wicks. Additionally, a dragonfly doji is generally, if it indeed leads to a trend reversal, followed by a long bullish candle. The candle of this week shows that the market did indeed start well, but that gradually the bulls slipped. The initial bullish candle is transforming into a bearish candle. It is true that we still have a few days before the week is over, but time and time again we see how quickly the market is relinquishing its territory. Last week I described how the bulls are lurking and it is clear that they indeed use every bit of positive news (in this case the dragonfly doji) to go into the attack. Nonetheless, the same graph shows that every attempt so far resulted in disappointment. I closed my last week's long at $ 6,483 and currently have no trading position in Bitcoin (except for a long term hodl). The altcoins are actually a lot more interesting at the moment because they show more volatility. For everyone who currently has a position in Bitcoin: remain vigilant because the direction of the price is unclear at the moment while the trend is still negative.