Bitcoin technical Analysis Update (BTC/USD): Breakout from inverse H&S Failed, A lesson in spotting failures beforehand.
Analysis Summary:
Hi Friends, welcome to this TA update of Bitcoin,
In my last post I said that BTC has experienced a breakout from the inverse H&S pattern but it has yet to define the breakout line as resistance which it was trying to do at that point of time.
Since my lat post BTC moved further higher signaling a breakout has happened but that was just the first try, BTC still needs to define that breakout line as resistance before making that inverse H&S pattern real.
And that brings me to my topic today is how to spot a failed breakout beforehand, specially such a crucial one.
You can see that I am using slowed down MACD from the usual parameters, that helps me in gauzing the situations much better and clear a lot of noise that usually happens to exist in the market at these crucial points of time.
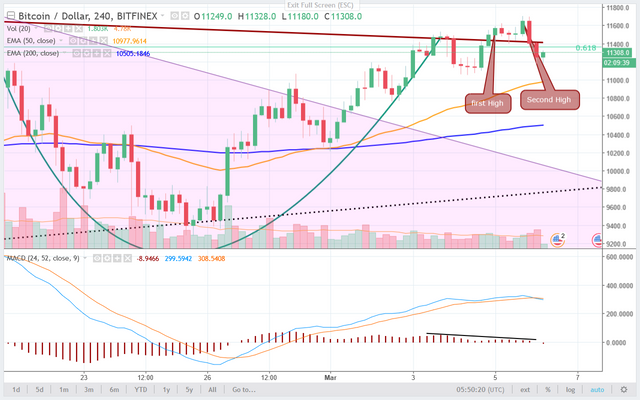
Further we need to pay attention to MACD histogram only, look for every higher high on the chart and see whether it is generating a higher high on the MACD histogram or not, if yes then a further rally is development. On the contrary a fall is in line. There can be false indication but only once not twice, our BTC chart is perfect for showing this.
You can see when BTC moved above the neck line, it formed two higher highs than the previous one on the chart but on MACD on this move fell flat which I have highlighted by a black trend line. MACD happens to be one of the strongest indicators of short term fall and rise.
Similarly on a falling chart if a lower low on chart fails to form a lower low on the MACD then that is sure to produce some green candles on chart. This happens to be only a short term indicator as you can see. But this sentiment matters even more during breakouts for setting long term targets. So guys keep attention at the MACD during the breakout.
Now coming to the chart I am sure another test to the breakout line will follow soon and this fall cannot sustain for long due to presence of some strong support down there, I am expecting the max that it can go down, will be EMA50 but if it breaks that down and then EMA200 as well then we are back to square one. However that is very unlikely to happen since we are now in an uptrend. Sooner or later we are sure to test the $13000 first and then $17000 as the inverse H&S target suggests.
So people wait and enter long only after a clear break above the neckline of the pattern and watch the MACD at that time before going long.
That will be all for now, I will keep you guys Posted in the as the chart develops further.
Till then Goodbye and Best of Luck to You People.

Hi, great post, worth a follow.
thanks for your kind words
You got a 2.27% upvote from @allaz courtesy of @ajai!