Another Useful Habit to Get Into, Trend-lines Habit
Thanks for coming back. I hope you have enjoyed the last few articles and found them useful. I’m going to be getting into another little useful habit that I have gotten into. If you have not read the previous articles in this series, I would suggest going back and checking them out. The info in those posts will help you understand what I’ll be talking about in this post. Enjoy!

So, just to recap, this is the fourth habit I have gotten into, so I can trade more quickly and efficiently. The first was using alarms to let you know when a trend is beginning, second we learned how to save a template of our studies, and the last habit was to save your entire chart, studies, fibs, trend-lines, and all, for each individual coin for quick reference. I personally do all of this on Coinigy, just like today. If you are not familiar with it, I hope you’ll check it out. It is well worth the money.
The habit I’m going to be talking about today is a bit simpler than the others, but I still think it is a useful thing to start doing, and it doesn’t take much effort to do. We are going to use different thicknesses and colors of trend-lines to help us read the chart more quickly and save time and money.
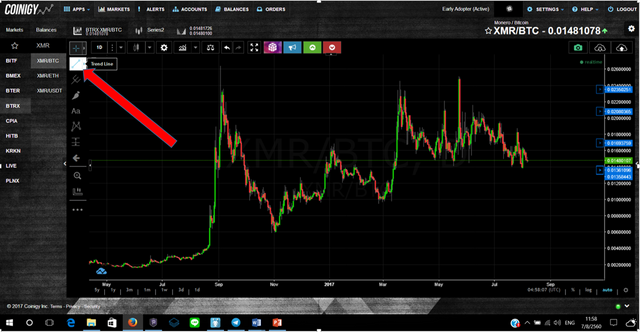
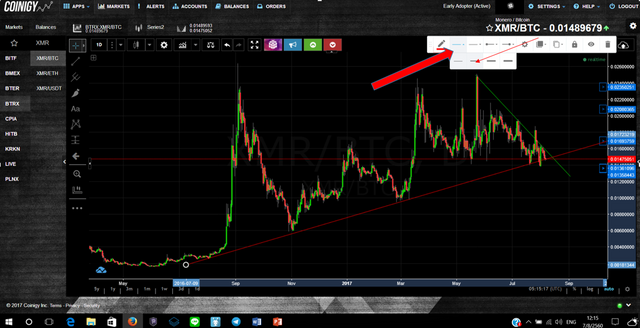
For this example, I will be using the XMR/BTC daily chart. The first thing I want to do is lay down my first trend line. The button for trend lines is right here.
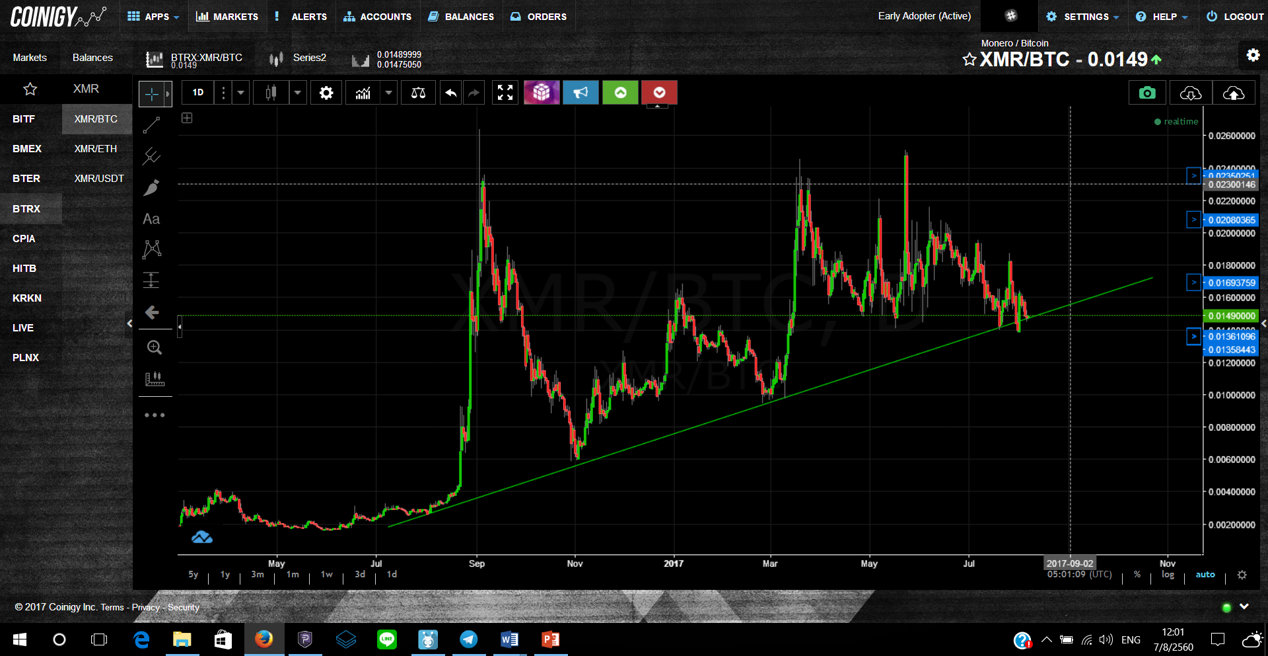
I started by laying the support trend line.
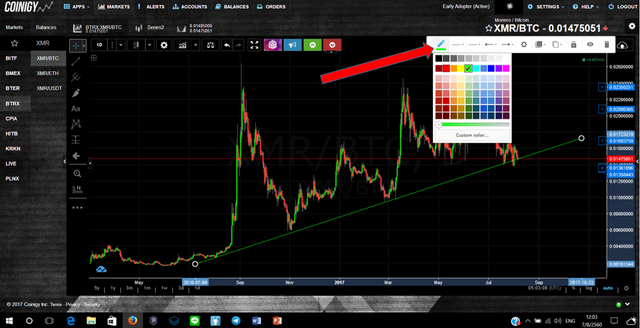
I personally like my support lines to be red and my resistance lines green, so I am going to change the color of the resistance line by clicking on it and then pressing this button here.
And now my support line is red, and I have drawn in the resistance line and made it green. Now a wedge has been formed, but which way is it more likely to break out of?
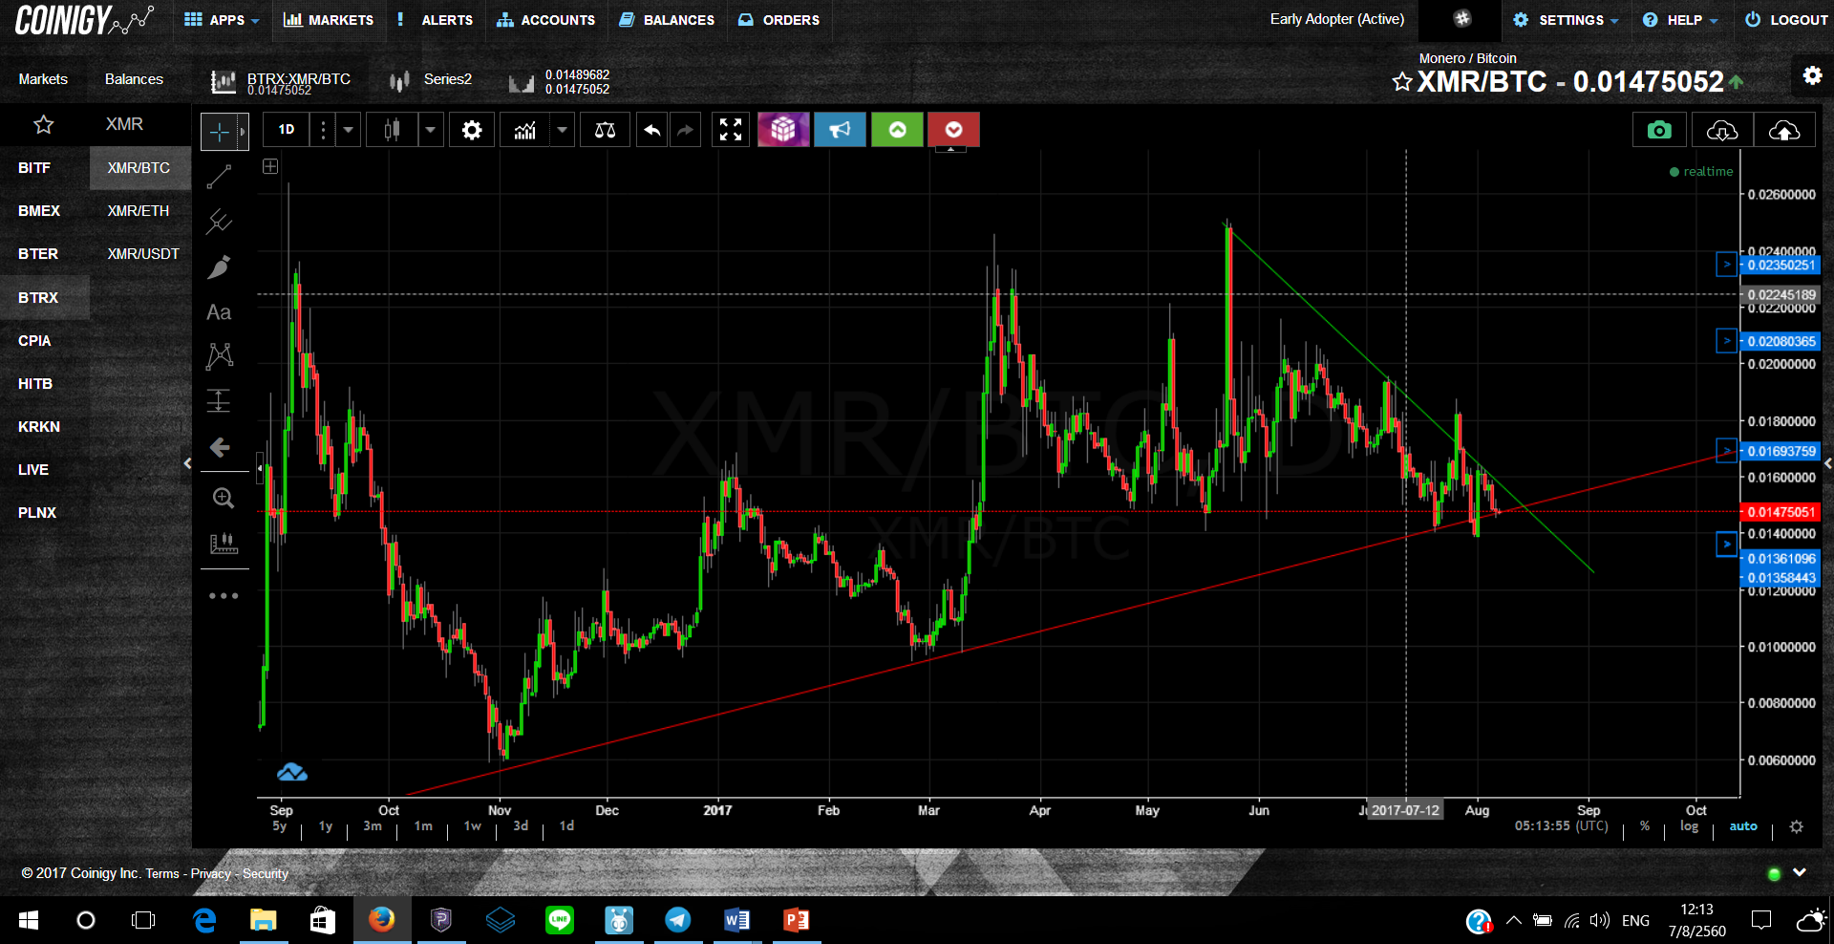
I think the red support line is the stronger of the two line forming the wedge since it has held longer over time, so I am going to make it thicker by clicking on it and pressing these two buttons here.
Now the red line is clearly thicker and gives a good visual indicator that can be understood at a glance.
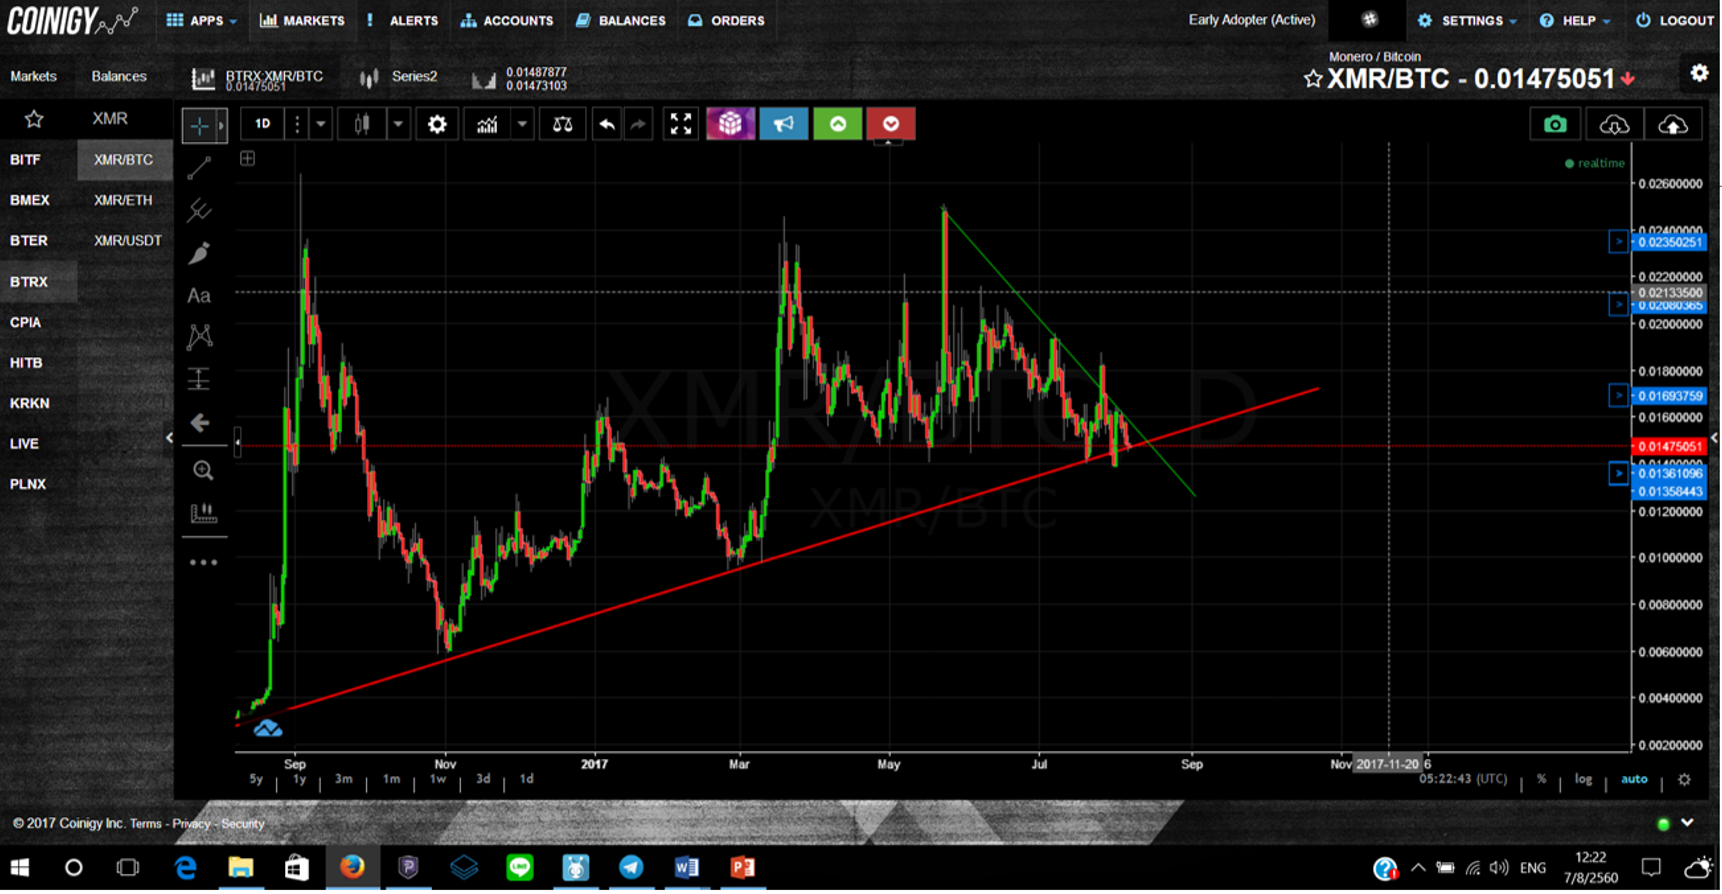
Here is an example of a situation where we have two trend lines coming together to form a wedge. Red line for support, green line for resistance. I have made the red line thicker because it looks like a stronger trend line than the green one. This makes it easier to know at a glance where you stand, understanding the situation that much quicker, and saving you time. Of course, it doesn’t really take that long to see what the stronger line is, but it is also doesn’t take much time to adjust the thickness of the line and save it for the future. These kinds of habits combined with other little time-savers can add up to a decent amount of saved time.
This can of course be applied to opposite situation, when the resistance line seems stronger. In that case, the green line would be thicker than the red line. If both of the lines seem equally strong then I do not thicken either of them.
Lastly, the most important part to this for me is then saving the chart layout, so I can come back and review previous wedges and trend lines that I have laid and see how accurate I was. I think this is a huge tool to use and to study with. It is good to know what things you have been doing right and what things you have done wrong, and correct that behavior.
Thanks again for reading. I appreciate all the views that I have been getting, and I hope this continues to be helpful info for you. If you have any questions, feel free to ask in the comments, and an up-vote is always appreciated. See you next time.
Chris the Agorist
Great step by step, keep it up!
Thanks! I appreciate it. I'll keep putting out some useful stuff.