Simple Charts Say It All - BTC Hitting Resistance @ 100EMA
Let us keep it simple. While fundamentals are truly better than ever and with a slew of wonderful sounding news smacking the headlines, it is time to take a look at a simple chart to gauge where BTC is heading.
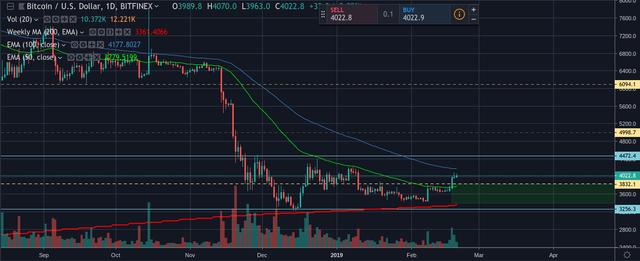
BTC has broken above the 50 day EMA which has been acting as a strong point of resistance.
It now is fading on momentum up to the 100 EMA that is laying just above the 4k level.
There is also strong overhead resistance to be challenged around 4.4K. And don't forget about the crucial 200 day EMA that is absent on this chart but has historically been under price whenever the bull market has actually been in full effect.
Before putting your 2017 Moon Boy pants back on and scoping out your future Lambo, understand that overhead resistance is strong and it may be too early to think we are entering a bull market. BTC has bounced twice of the 200wk MA, making me believe that this indicator will act as a potential permanent floor. This is the reason for the green rectangle that represents what is personally believed to be a quality buy zone.
Patience > FOMO.
View this chart on TradingView.com

Congratulations @aferrell! You have completed the following achievement on the Steem blockchain and have been rewarded with new badge(s) :
Click here to view your Board
If you no longer want to receive notifications, reply to this comment with the word
STOPTo support your work, I also upvoted your post!
Congratulations @aferrell!
You raised your level and are now a Minnow!