Hodl Your Pants! BTC Weekly Chart Is Less Exciting And Telling
As BTC marches towards the resistance at 4.4K, which was not only prevalent in November and December, but also the end of 2017, there is a TON of bullish sentiment around the internet. Before you FOMO in, look at the weekly chart.
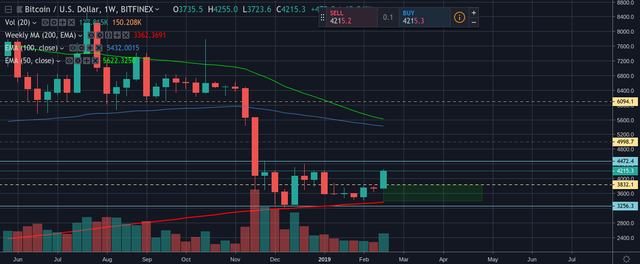
What the weekly shows us is that the 4.4K is still a hurdle and the moving averages are coming down to hit price right on the head.
The move up is exciting, and considering the 200WMA is continuing to curl up, there is truly a reason to be bullish. But, make sure to look at the long term time frames. They paint very good pictures of the current trend. BTC is going to have to close and open above 4.4K for warranted bullishness to come in. Until then we are still in the range between the 200WMA and 4.4K
Patience > FOMO.

Congratulations @aferrell! You have completed the following achievement on the Steem blockchain and have been rewarded with new badge(s) :
Click here to view your Board
If you no longer want to receive notifications, reply to this comment with the word
STOPTo support your work, I also upvoted your post!
Magic Dice has rewarded your post with a 60% upvote. Thanks for playing Magic Dice.