Technical Analysis on Bitcoin: Something needs to happen!
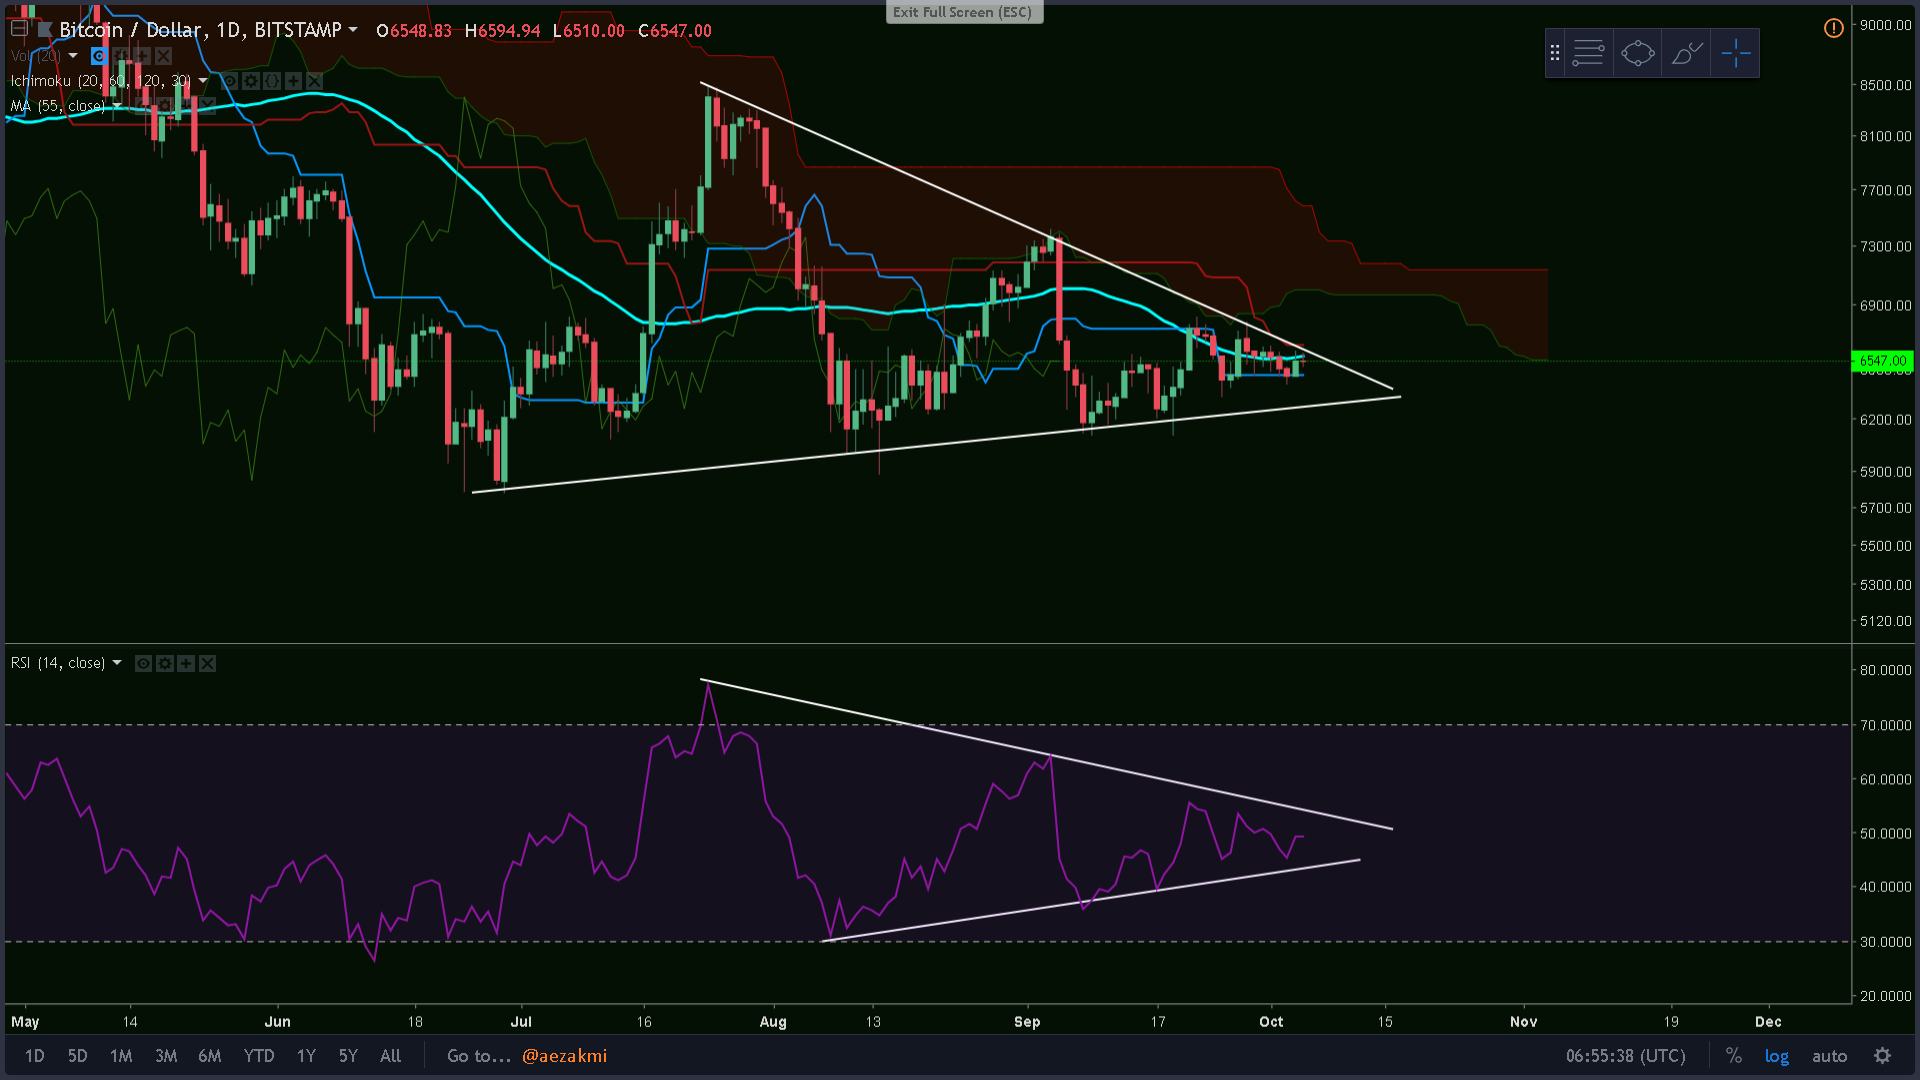
Bitcoin has formed a symmetrical triangle pattern and both a breakout and a breakdown could happen. I could see it breakout this time, because the 6000$ level has proven to be a very good support for us and breaking below this level will result in a further and longer 'correction'. Right now we're hovering between the Ichimoku's Tenkan (good support in the last few days) and the 55 day MA (light blue).
Click here to enlarge the image
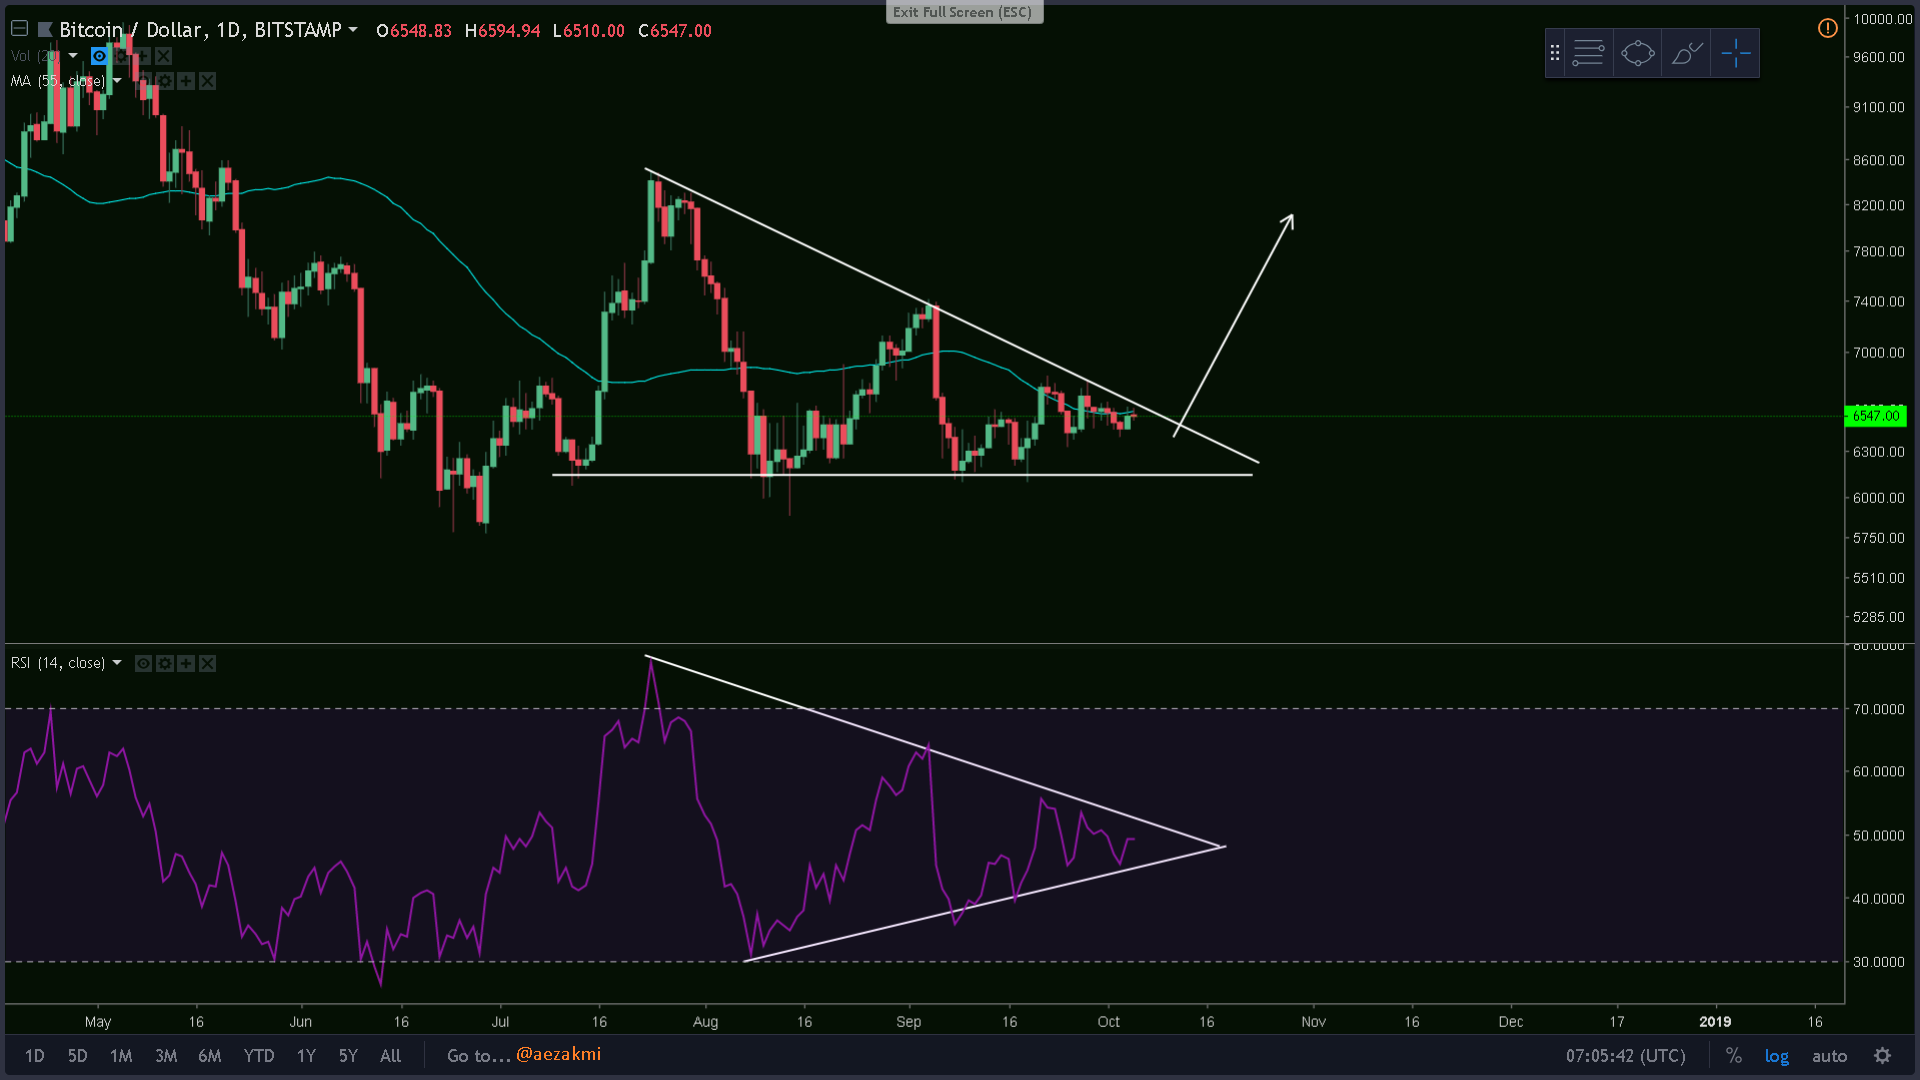
Another look at the chart with the base line being a horizontal line, both patterns are working. We can see the divergence on the RSI: the bounces on the ~6100$ line are not confirmed by the RSI, which indicates higher lows in all cases. This could be seen as a bullish divergence.
Click here to enlarge the image

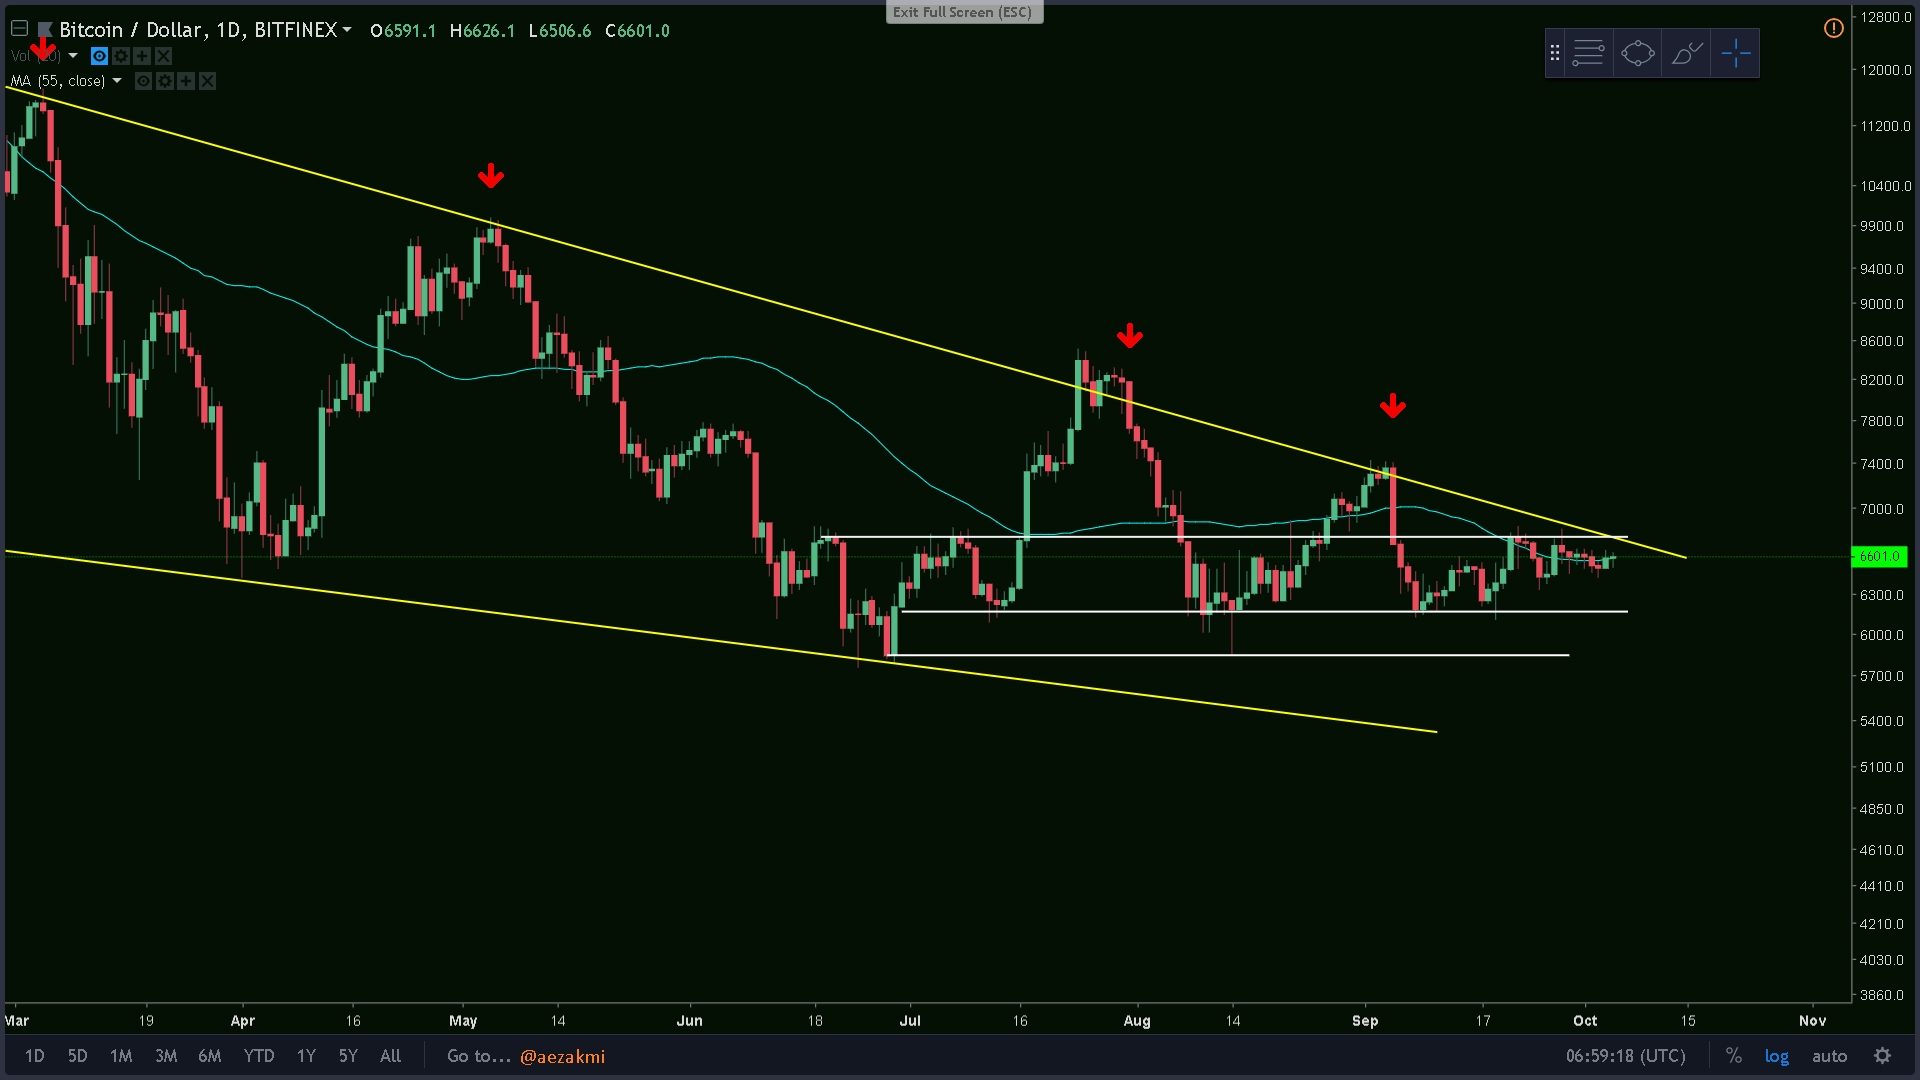
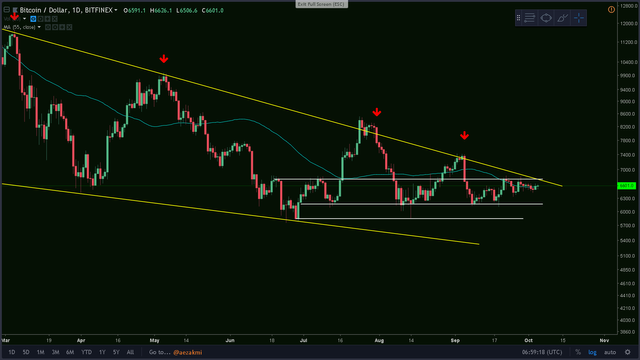
However, looking at the bigger channel, we can see that we're approaching once again the upper, descending trend line, which acted as our resistance many times before. So yes, something need to happen. It must. Taking another hit with such long, red candles and great Volume like in January or March, could bring us to the 5100$ range, at the lower descending trend line.
Click here to enlarge the image


These are some of the exchanges I use. Here you can find the coins I'm talking about:
(you can support my work by registering via these links)
- Bitfinex - my most used exchange
- Binance - most popular exchange
- Kucoin - excellent exchange, rising in popularity
- Gate - for small cap / new coins
- Huobi - margin trading
- Coinexchange - big variety of coins
ALWAYS CREATE A DIFFERENT PASSWORD FOR EACH EXCHANGE!NEVER HAVE THE SAME PASSWORD TWICE!SAVE THE PAGES TO YOUR BOOKMARKS, SO THAT YOU WON'T CLICK ON SCAM SITES! MANY GOT FOOLED AND LOST A LOT OF MONEY!Thanks for reading and safe trading!✌
If you find this post useful, please:
