Technical Analysis on Bitcoin: holding the support & possible continuations
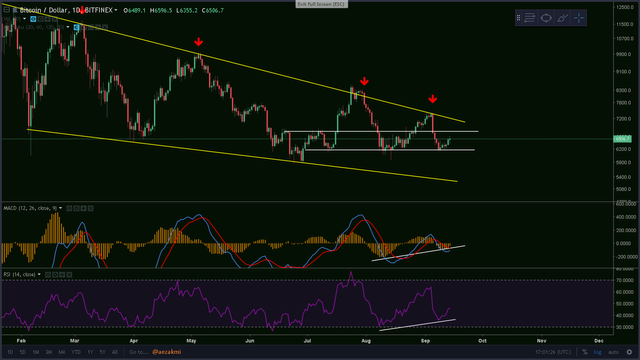
Bitcoin is holding very good the support at the lower white trend line. So far, it looks like we've broken the bearish trend and are currently in a sideways movement, possible the beginning of the bullish trend. We can see the bullish divergence on the RSI and the histogram of the MACD: the price indicate a double bottom, whilst the RSI and MACD indicate a higher low.
Click here to enlarge the image

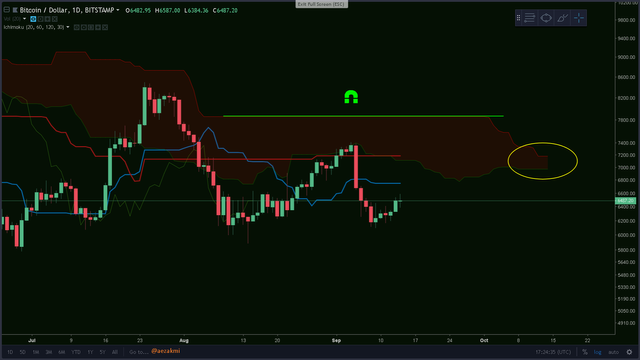
Using the Ichimoku cloud indicator we can see that we've broken both the Kijun and Tenkan. The flat top of the cloud usually acts like a magnet, so we still can see a touchdown at that level. Also, the red cloud seems to finally close after a long period (circle)
Click here to enlarge the image
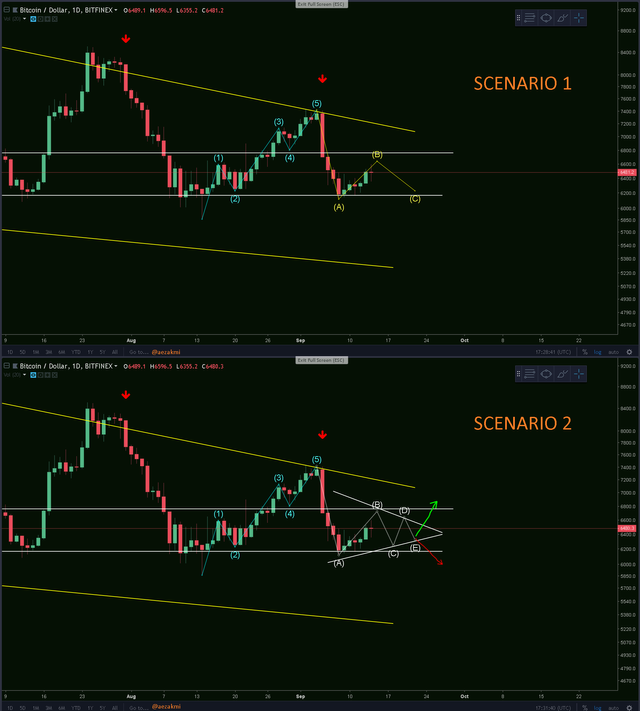
After the 5 wave - impulse Elliot cycle, a ABC correction usually occurs. SCENARIO 1: We can see a ABC flat formation, with A and C staying at the same level. If C goes below the beginning of the first wave of the 5 wave cycle (6000$), the ABC correction is cancelled. SCENARIO 2: There's also the possibility of a ABCDE wedge correction cycle, with the price forming a wedge (bullish or bearish!!). If the second scenario happens, I'll opt for a bullish breakout!
Click here to enlarge the image
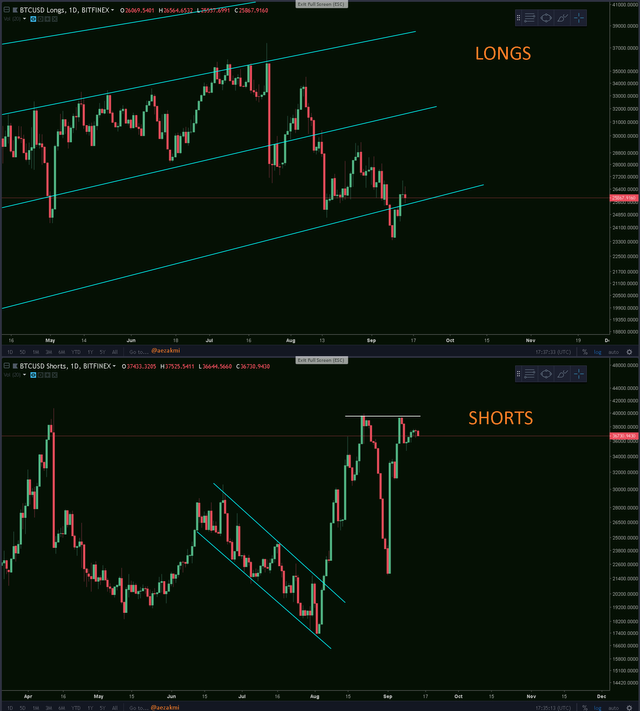
LONGS vs SHORTS: the longs started shyly rising again and the shorts flattened out after a double top. None of them are having a massive response to the current market situation.
Click here to enlarge the image

These are some of the exchanges I use:
(you can support my work by registering via these links)
- Bitfinex - my most used exchange
- Binance - most popular exchange
- Kucoin - excellent exchange, rising in popularity
- Gate - for small cap / new coins
- Huobi - margin trading
- Coinexchange - big variety of coins
ALWAYS CREATE A DIFFERENT PASSWORD FOR EACH EXCHANGE!NEVER HAVE THE SAME PASSWORD TWICE!SAVE THE PAGES TO YOUR BOOKMARKS, SO THAT YOU WON'T CLICK ON SCAM SITES! MANY GOT FOOLED AND LOST A LOT OF MONEY!Thanks for reading and safe trading!✌
If you find this post useful please:
