Technical Analysis on Bitcoin and possible continuations
Bitcoin
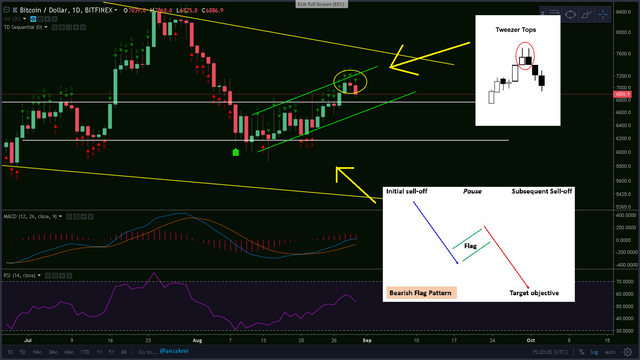
Bitcoin had a small drop today, after closing two days in a row and forming a tweezer top formation. It also looks like we're possibly forming a flag, a bearish flag more exactly, which usually ends with a breakdown and a further down trend. The TD Sequential indicator is at the 8th candle on the daily chart and if we close tomorrow our 9th candle above 6900$, it will indicate a sell. The last 9th bullish candle (on August 8th) worked pretty well.
Click here to enlarge the image


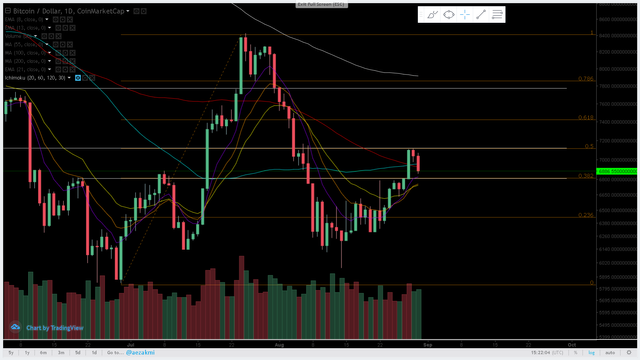
A better look to the charts tells us that Bitcoin got rejected exactly at the 0.5 fibonacci retracement from the previous run. Now we're heading towards the 0.382 level, but I don't believe that we will close below the 55 and 100 Moving averages.
Click here to enlarge the image


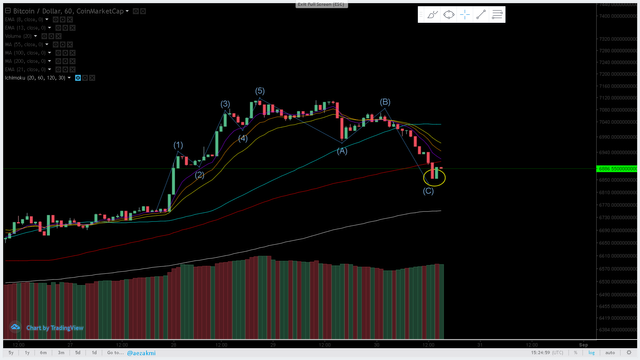
On the 1h chart it seems that we have completed a 5 wave Elliot cycle with a ABC correction. The C wave could, however, extend a little more. Also, a new cycle could begin, bringing Bitcoin to a new recent all time high.
Click here to enlarge the image


These are some of the exchanges I use:
(you can support my work by registering via these links)
- Bitfinex - my most used exchange
- Binance - most popular exchange
- Kucoin - excellent exchange, rising in popularity
- Gate - for small cap / new coins
- Huobi - margin trading
- Coinexchange - big variety of coins
ALWAYS CREATE A DIFFERENT PASSWORD FOR EACH EXCHANGE!NEVER HAVE THE SAME PASSWORD TWICE!SAVE THE PAGES TO YOUR BOOKMARKS, SO THAT YOU WON'T CLICK ON SCAM SITES! MANY GOT FOOLED AND LOST A LOT OF MONEY!
Thanks for reading and safe trading!✌
If you find this post useful please:

excellent...upvoting and supporting! Quality work without a doubt.
Thank you @yankee-statman. Appreciate the kind words.