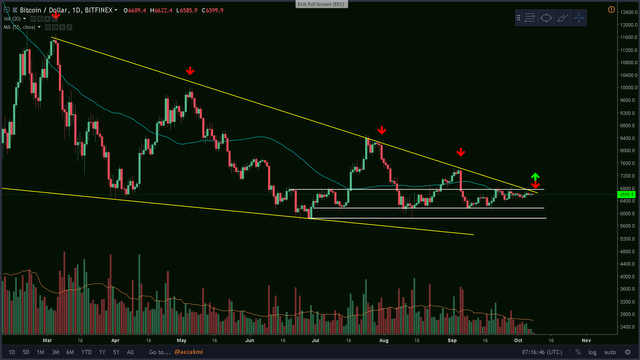
Bitcoin: The Moment of Truth. Where do we go now?
It is happening: we're back at the long descending trend line, waiting to see where the momentum of the market is heading in the next period. Will we see another drop in BTC's price or will we see the first breakout in more than 8 months? Right now we're at the point where the horizontal resistance line meets with the yellow descending line, continuing our boring 10% channel movement. These days Bitcoin will have to show us where it wants to go.
Click here to enlarge the image
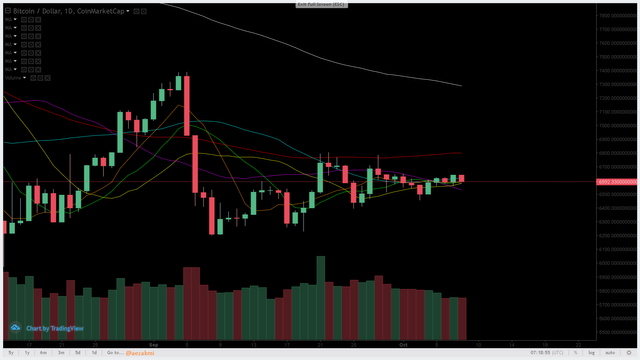
Moving Averages: we are at the 55 day MA (blue), finding support at the 21 (yellow). However, we are still under the 100 day MA (red - which changed the momentum and is going upwards) and the 200 day MA (grey).
Click here to enlarge the image
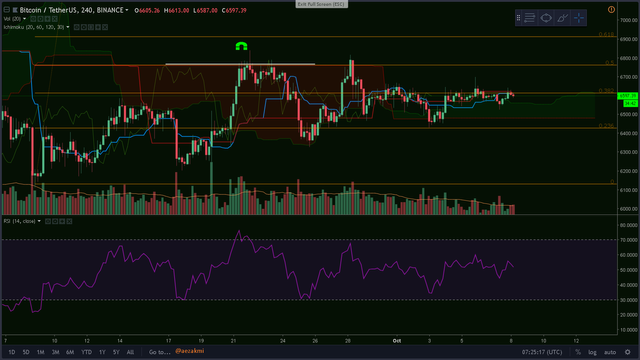
Bitcoin 4h chart: there's some resistance at the 0.382 fibonacci retracement level from our last major move. We are above a green Kumo and are waiting for a bullish Tenkan cross (blue above red). My last call was pretty accurate: I said that the flat top line of the cloud (this time aligned perfectly with the 0.5 fib. retracement) can act like a magnet and 'pull' the price towards it. And pretty much this happened.
Click here to enlarge the image


These are some of the exchanges I use:
(you can support my work by registering via these links)
- Bitfinex - my most used exchange
- Binance - most popular exchange
- Kucoin - excellent exchange, rising in popularity
- Gate - for small cap / new coins
- Huobi - margin trading
- Coinexchange - big variety of coins
ALWAYS CREATE A DIFFERENT PASSWORD FOR EACH EXCHANGE!NEVER HAVE THE SAME PASSWORD TWICE!SAVE THE PAGES TO YOUR BOOKMARKS, SO THAT YOU WON'T CLICK ON SCAM SITES! MANY GOT FOOLED AND LOST A LOT OF MONEY!Thanks for reading and safe trading!✌
If you find this post useful, please:
