Bitcoin: Possible Signs Of A Further Rally
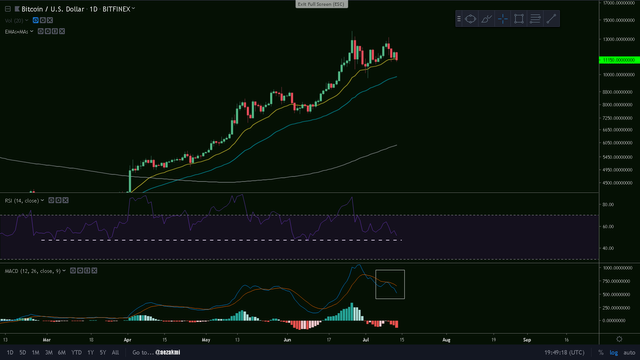
Bitcoin Daily (1)
- we're holding above the 21 day EMA (yellow) for now
- notice how the RSI approaches the 40-ish mark, where we saw a few bounces before; actually all our rallies started from this RSI level in the last months, so it might happen again
- the MACD indicates a rejection at the signal line and an increasing bearish Histogram
Ctrl + Click here to enlarge the image in a new tab (steemitimages)

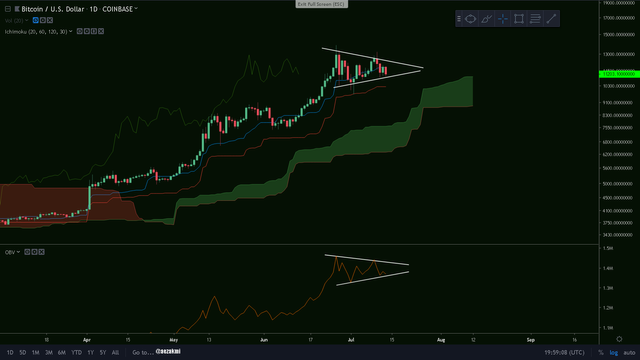
Bitcoin Daily (2)
- it looks like we're building a symmetrical triangle, which can break either way
- we broke Ichimoku's Tenkan and are heading again toward the Kijun, still having a thick support-cloud below us
- the OBV also indicates a symmetrical triangle and it usually leads the way, breaking the support/resistance before the price does, so keeping and eye on it could turn out to be pretty wise
Ctrl + Click here to enlarge the image in a new tab (steemitimages)

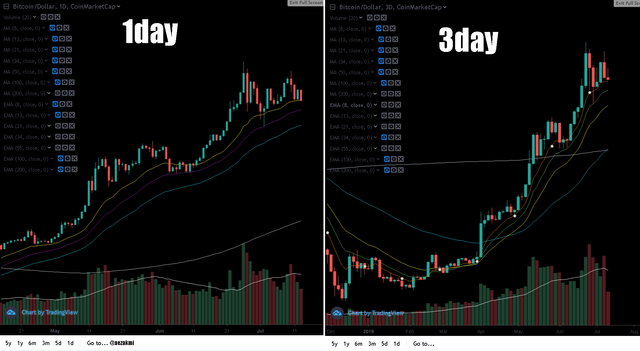
Moving Averages
the Daily chart: we're finding support at the 21 (yellow) EMA and will probably revisit the 34 (purple). As I said in my previous posts, our next bigger corrections will take us to the 55 EMA (blue) and perhaps to even lower levels, such as the 200 day MA (grey)
the Three day chart: for now, we're finding support very clearly at the 8 EMA (brown), with wicks extending to the 13 (green) and finally have the 55 (blue) crossing the 200 (grey), which in 2015 marked the beginning of the bull-run, with the price finding support at the 55 every now and then
Ctrl + Click here to enlarge the image in a new tab (steemitimages)


Thanks for reading!

- My most used Exchanges:
- DRUGWARS - Play smart and earn STEEM!
Find me on Twitter for updates
STAY SAFE - TIP: ALWAYS CREATE A DIFFERENT PASSWORD FOR EACH EXCHANGE!NEVER USE THE SAME PASSWORD TWICE!SAVE THE PAGES TO YOUR BOOKMARKS, SO THAT YOU WON'T CLICK ON SCAM SITES!
Thanks for reading and safe trading!✌
If you find this post useful, please:

And here we are: