Bitcoin latest Price Action: a closer look at what's going on
A look at the chart
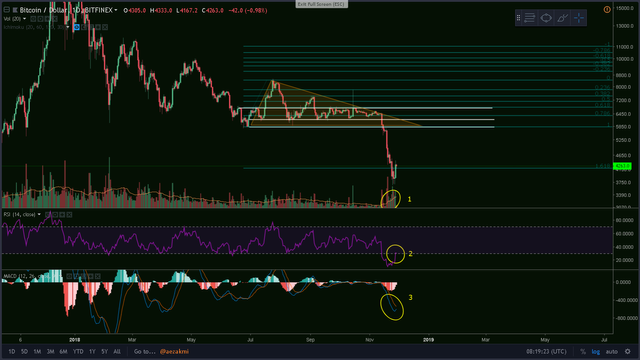
After the sudden and continuous fall, Bitcoin managed to close yesterday above the 1.618 Fibonacci retracement line, with a strong 12% gain. Despite the disappointing drop, the trading volume (1) is finally increasing, after a long period of steadiness. The RSI (2) struggles at the moment at the 30 mark and the MACD (3) seems to turn bullish again, with the blue line crossing the signal line in the next few days.
Click here to enlarge the image

Moving Averages (daily)
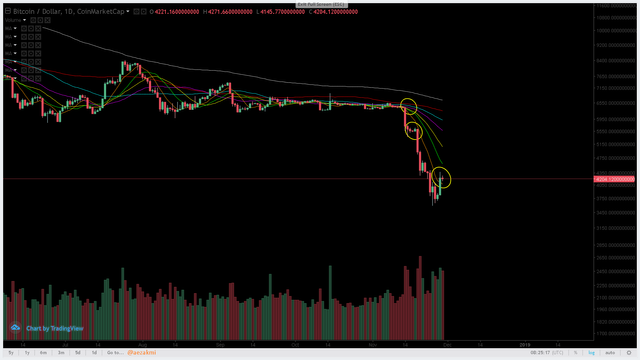
Since the crash started, the 8 day MA was out guidance point. We interacted with it three times: the first two times when we touched it, we immediately dropped, but the third time we actually crossed and closed above it, something like "previous resistance becomes support".
Click here to enlarge the image

Moving Averages on bigger timeframes (weekly)
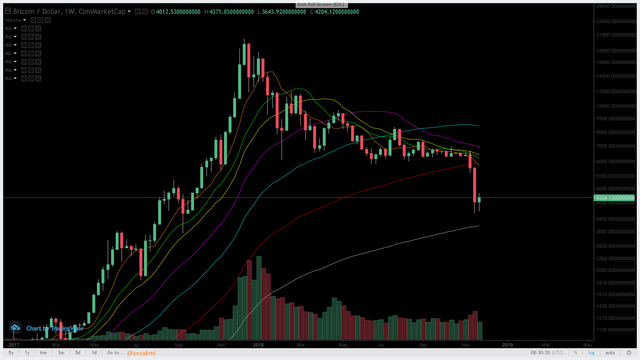
Some Crypto analysts suggest that the weekly 200 MA is our next 'stop', as history repeats itself. This would be quite a powerful sign to look at.
Click here to enlarge the image

Moving Averages on bigger timeframes (monthly)
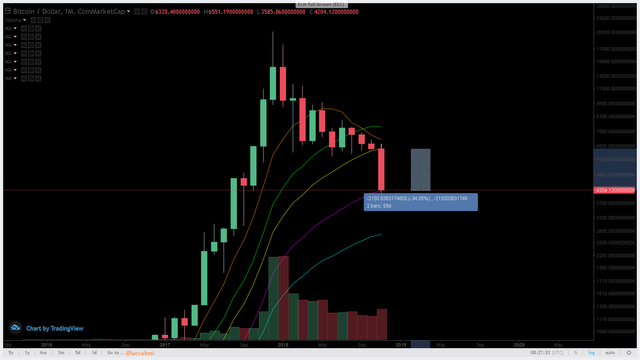
The drop in the last month is exactly between the 21 MA (yellow) and the 34 (purple). I believe that this monthly candle won't close under the 34 MA.
Click here to enlarge the image


These are some of the exchanges I use:
(you can support my work by registering via these links)
- Bitfinex - my most used exchange
- Binance - most popular exchange
- Kucoin - excellent exchange, rising in popularity
- Gate - for small cap / new coins
- Huobi - margin trading
- Coinexchange - big variety of coins
ALWAYS CREATE A DIFFERENT PASSWORD FOR EACH EXCHANGE!NEVER HAVE THE SAME PASSWORD TWICE!SAVE THE PAGES TO YOUR BOOKMARKS, SO THAT YOU WON'T CLICK ON SCAM SITES! MANY GOT FOOLED AND LOST A LOT OF MONEY!
Thanks for reading and safe trading!✌
If you find this post useful, please:
