Crypto, flat corrections, and the fractal nature of progression. An overview of "flat" corrections.
I've talked to a lot of people that have said it's impossible to forecast markets, many people will say that technical analysis will never work, and you need to focus on fundamentals. I will agree that fundamentals will drive the market, but is there a way to not need to focus on them, or completely disregard them when it comes to trading/forecasting?
In my opinion the answer is yes, there are ways to accurately predict movements in the market. Something that I've noticed by studying charts for the last two years is that there are patterns that repeat themselves time and time again. In this post I'm going to focus on the "flat" pattern & the fractal nature of the pattern.
This pattern was first realized by Ralph Nelson Elliott in the 1930's. We won't get too deep into Elliott's discovery in this post, I'm going to save that for a later date. If you have yet to read about his analytical theory, I highly recommend picking up the Elliott Wave Principle. (If you're feeling like a boss mf'r get the hardcover)
Lets get back to business. The reason I'm picking the "flat" pattern is because it's the most common pattern you will see. This can be found in any type of data plotted on a chart, even ones that have nothing to do with financial instruments! We're also going to dive into the fractal nature of this pattern/correction.
Before we jump to examples we should get an understanding of a fractal
Frac-tal-
a curve or geometric figure, each part of which has the same statistical character as the whole.
In simple terms a pattern in a pattern, in a pattern, in a pattern, in a pattern....
Okay lets check out some examples. I will focus on Bitcoin, but I will post other relevant charts.
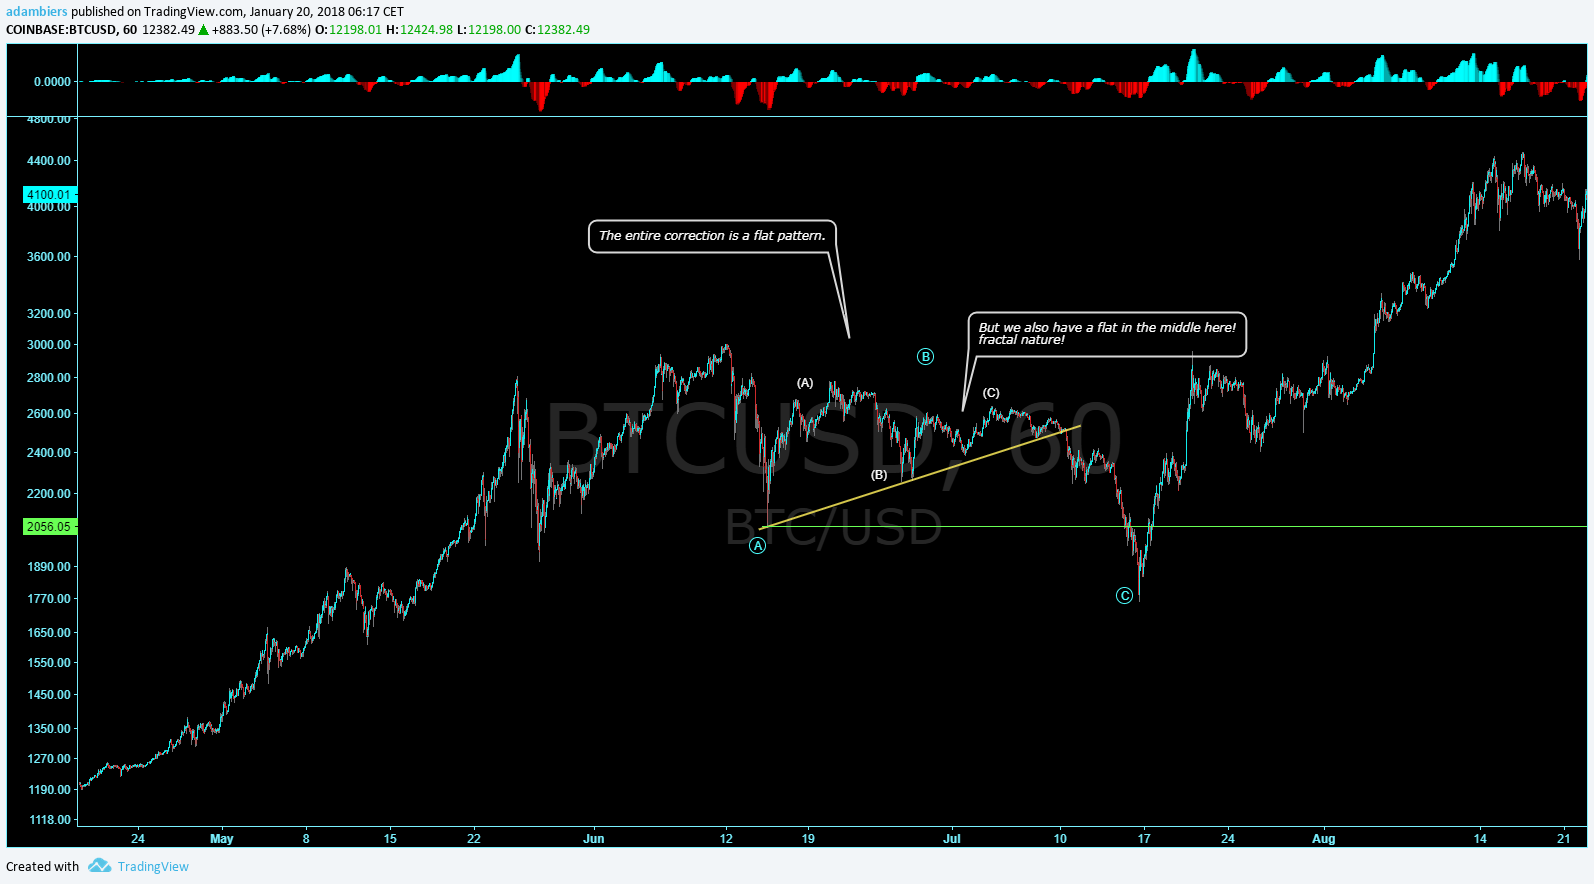
This was the correction @ 3k when everyone thought Bitcoin was done for, for the 5th time. Flats consist of 3 waves labeled A-B-C. Internal (subwaves) can be 3-3-5 and 3-3-3. I can show examples of both. Many Elliotticians will follow the book religiously, which I don't agree with. In a later post I will share my views on some minor flaws with doing that.
You can see that the overall pattern is a flat, and there is also a flat in the middle! A fractal pattern! Neat :)
Let's check out the current correction. (Which I think is over and we're back into motive trend)
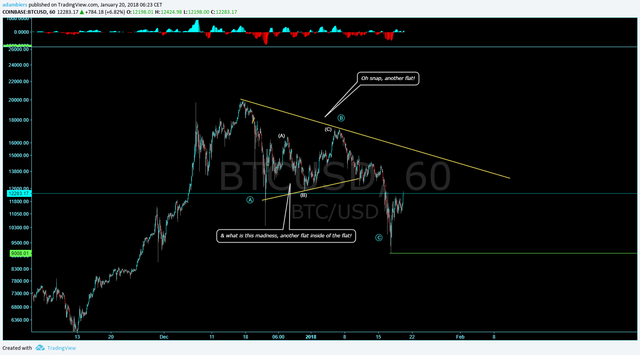
Notice how similar they are? How is this possible with HFT and algos killing the market? (common thing said by people who say forecasting is impossible)
I want to find lower degree flats too. One just happened on the 1hr chart. let's check it out!
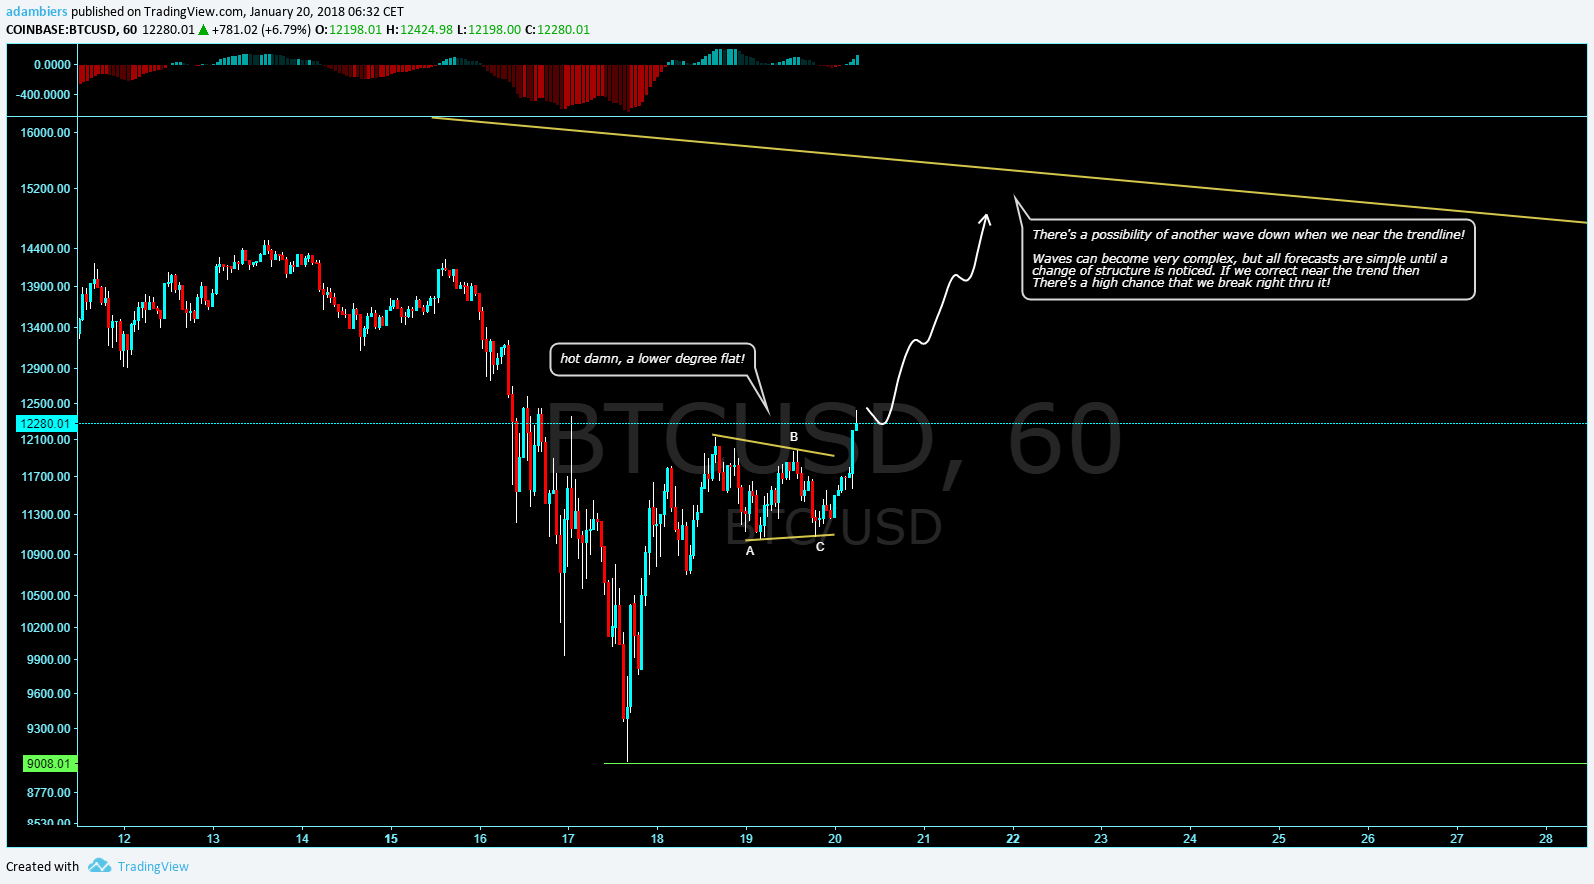
Flats happen all the time, across all time frames... like I said, it's the most common pattern we will see.
Now we're about to look at some other charts!
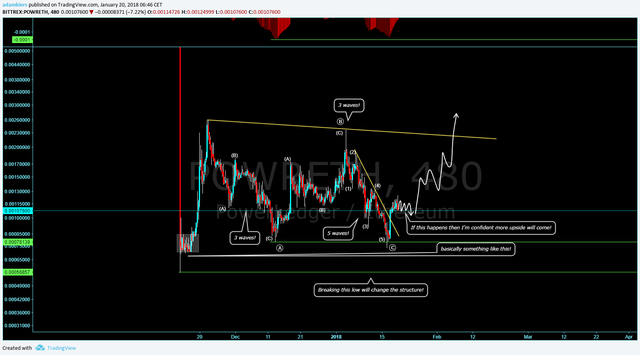
Here is one on PowerLedger. First wave down has 3 waves, 2nd up has 3 waves, and 3rd wave has 5! Hey that sounds like a flat! There is also a chance this becomes a Triangle (5 waves with subwaves of 3) I'll cover those in another post! If it breaks the low then it changes the structure and I will need to re-analyze! That sounds like a rule... I'm really not fond of rules but when it comes to trading and forecasting they are absolutely essential. Trading needs to be rule based!
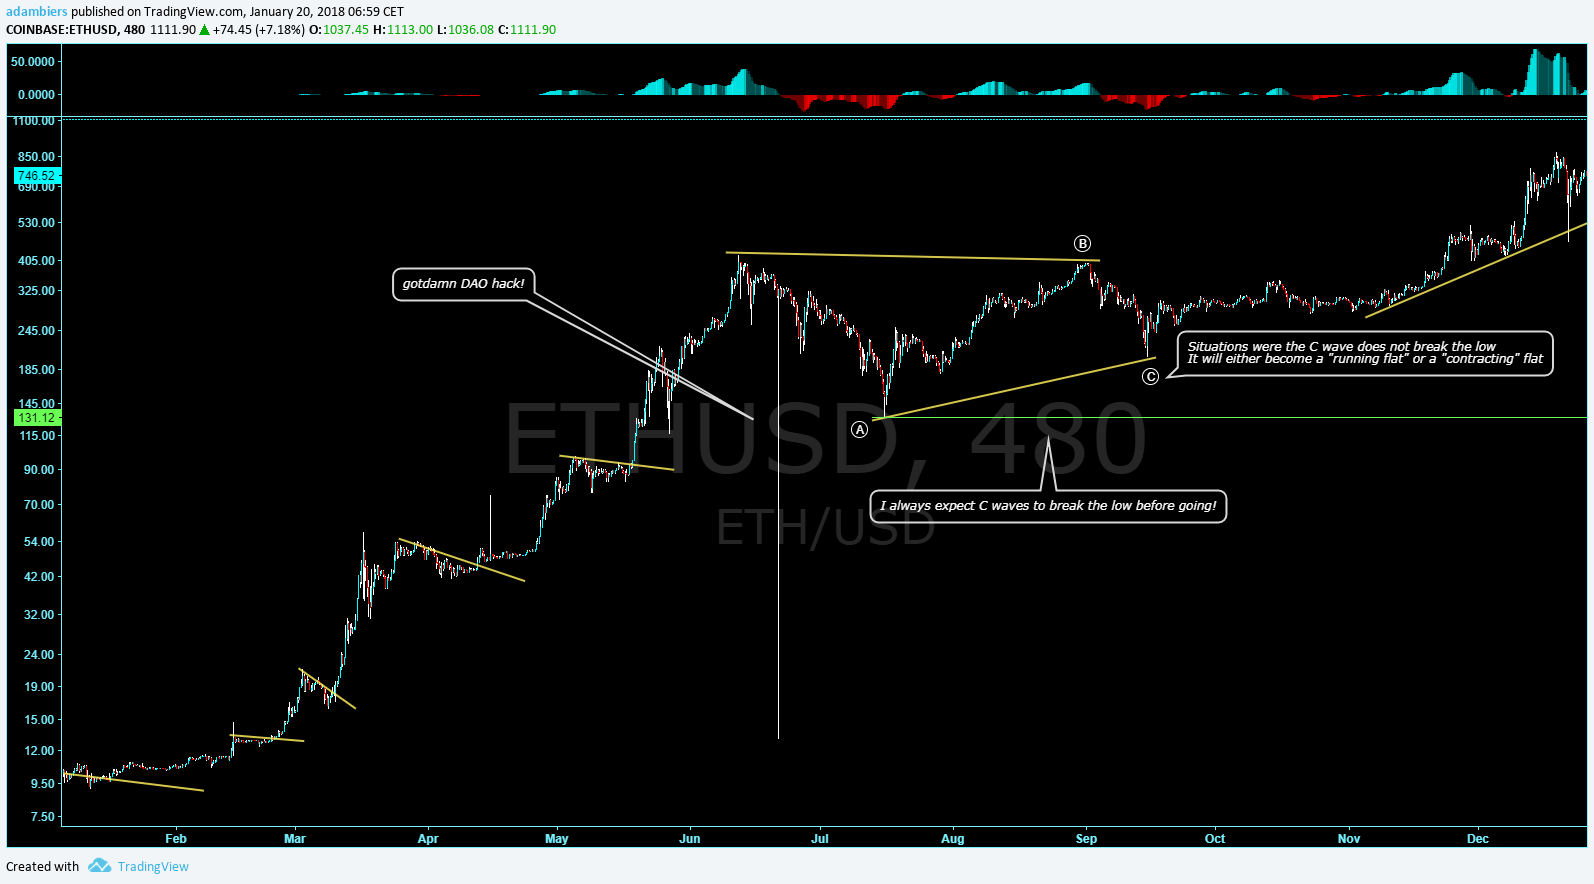
Here's a good one on ETH that shows another flat. In this case we have a "contracting flat" This is where the B wave does not break the start of the A wave, and where the C wave does not break the bottom of the A wave. A "running flat" is a structure where the B wave breaks the start of the A wave, but does not break the bottom of the A wave. One thing that is interesting about this chart, is an unexpected event tanked ETH that one day, but the structure will remain the same. Switch to a line chart if you don't believe me! ;)
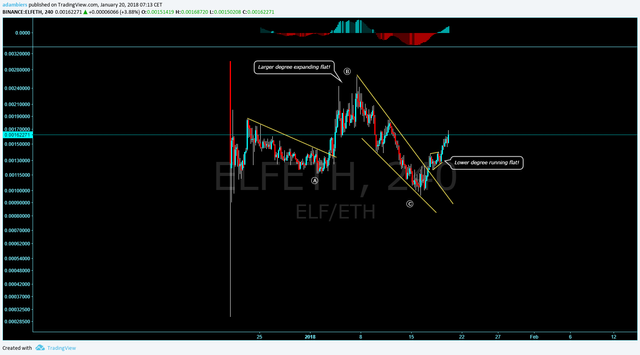
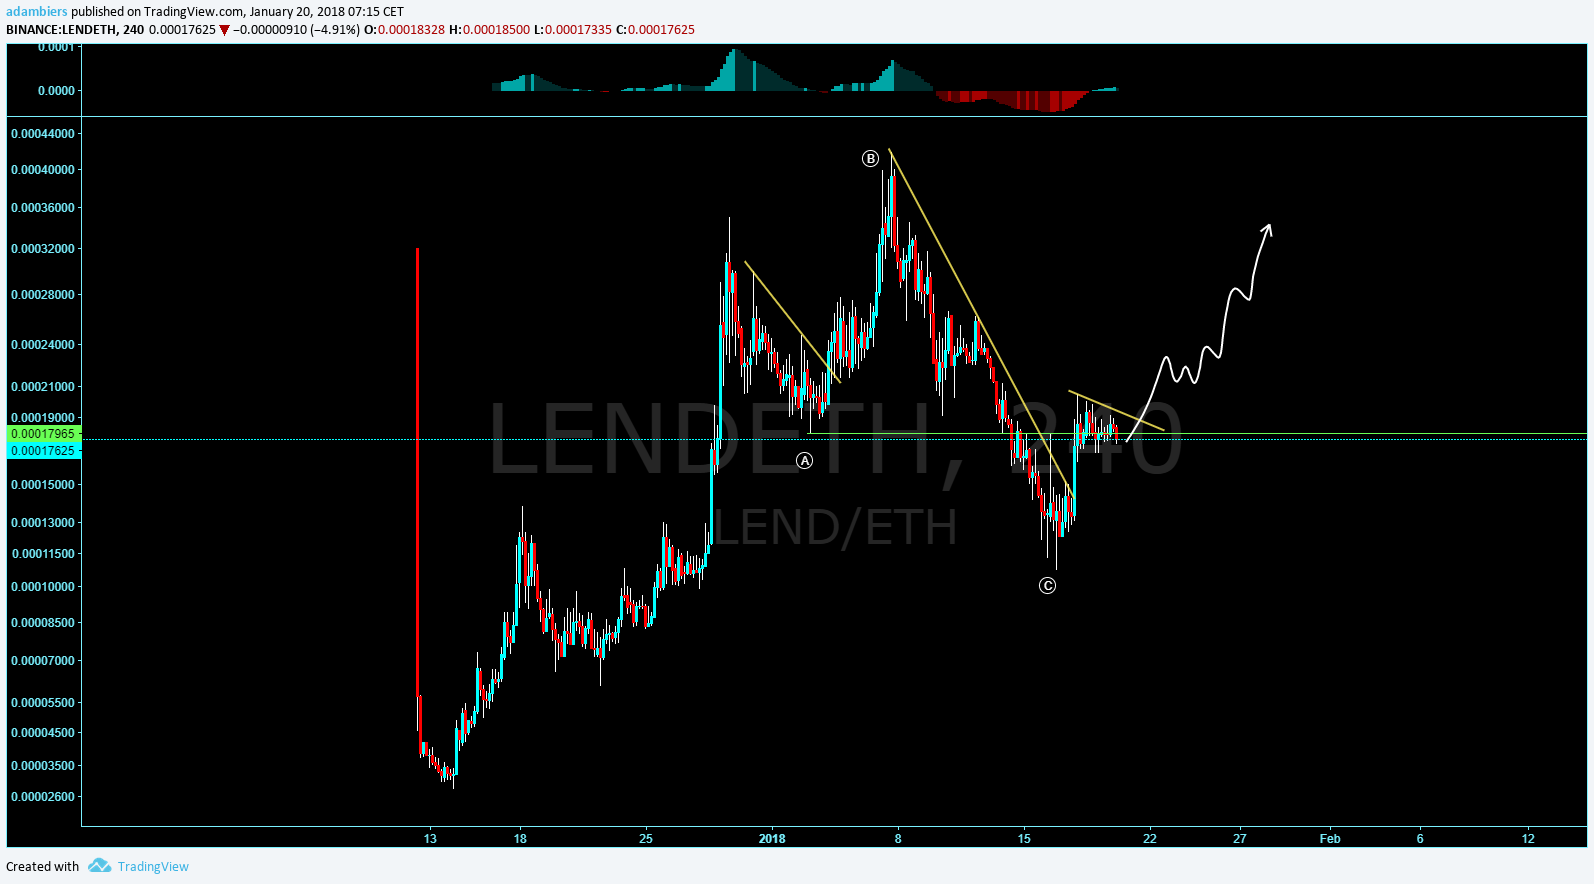
Here's two larger degree "expanded flats" on AELF and ETHLend. The're not confirmed yet but I'm in the trade and plan on adding more. There will always be risk in trading/investing. Rewind to when I was babblin' about rules. When things don't go my way I need to be out of the trade. If you haven't already, it might be time to add some rules to your strategy!
Okay one more and I'll wrap this thang up!
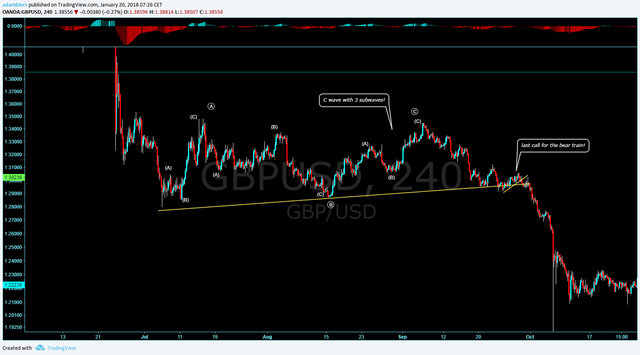
I wanted to go over this Pound/US dollar chart (I know, I know, f@$k fiat)!
Just because it's a C wave with 3 subwaves instead of 5. C waves in flats can be both 3 & 5 waves. They both exist. I wanted to bring this up because internal waves aren't so important. If you can find the largest degree correction, it will be easier to trade than to spend all day labeling waves and trying to figure out what in sam hell is going on!
I want to thank you for taking the time to read this post & hope you have found some value with this blog. I plan to go more in depth on my strategy, and all things to do with wave patterns with future posts!
To check out all current forecasts check out my group on facebook!
https://www.facebook.com/groups/1895958077333696/
This is not investment advice, just a practical way of using wave analysis to forecast the direction of a trend.
Trade responsibly,
-Adam Biers
Coins mentioned in post:
Thank you! Neat way to track where it is weeks from now when I look back at it. Will the coin matrix update automatically?
Its a bot, Adam.
I am following you with my brain open. Thanks alot bro!
good work from your stock market 2018 family
Thank you! I appreciate you checking it out! I'm glad you found some value! I plan on making a lot of posts about wave analysis and how it can be helpful in trading!