Bitcoin, Ethereum, Ripple, BitcoinCash Price Analysis .... 📶

Among the top four @cryptocurrencies, @Bitcoin has taken the lead and is marching ahead, making lifetime new highs on a regular basis, while the others are still far away from their peaks. Nonetheless, @Bitcoin has pulled the whole cryptocurrency universe along with it. The total market capitalization of the 843 digital currencies has reached above $132 bln.
So, can this bullish trend continue or are we looking at another correction in the short-term? Let’s see what the chart patterns tell us. We start with the leader – @Bitcoin.
BTC/USD
@Bitcoin was range bound between $2,999.99 and $1,913.19 for about two and half months. The breakout of the range had a pattern target of $4,086.79, which has been reached. We should see a consolidation or a mild correction of one to three days at the current levels before the uptrend continues.
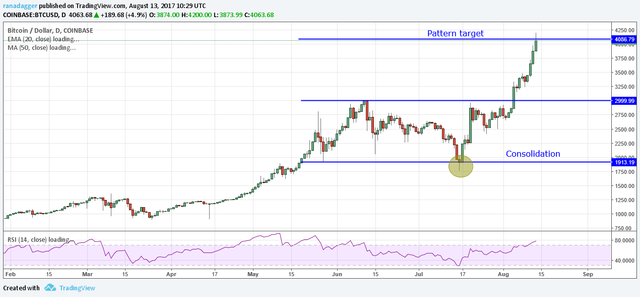
Therefore, traders who have positions from lower levels might want to book partial profits at the current levels. Avoiding fresh positions seems like a good idea until we see a small dip or a consolidation, which will give a good stop loss point.
However, if the momentum continues and Bitcoin breaks out of $4,086.79, it can rally to $4,630.19.
ETH/USD
@Ethereum is presently facing resistance at $323.69 levels, which is just above the 61.8 percent Fibonacci retracement levels of the fall from $420 to $130.26; we are not considering the lows of the flash crash of June 21 for this calculation.
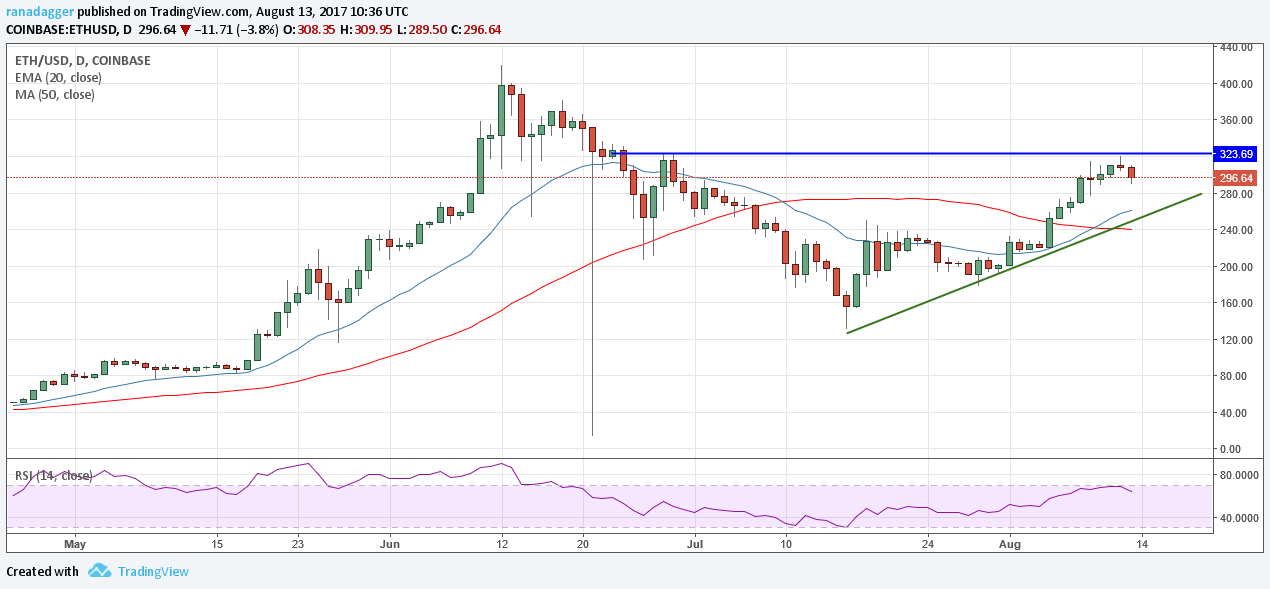
The current fall can extend to $270, where the currency has dual support – from the trendline and the 20-day exponential moving average (EMA). We can expect this level to hold. Therefore, a buy closer to the trendline with a stop loss just below it may offer a good entry point with a small risk. The first target will be $323.69, above which a move to $381 is possible.
If, however, the trendline support breaks, a fall to $215 and $180 is likely.
XRP/USD
A large descending triangle is forming on the daily chart of XRP/USD. The bearish pattern will complete on a fall below $0.135. In the short-term, however, there is support at $0.15460.
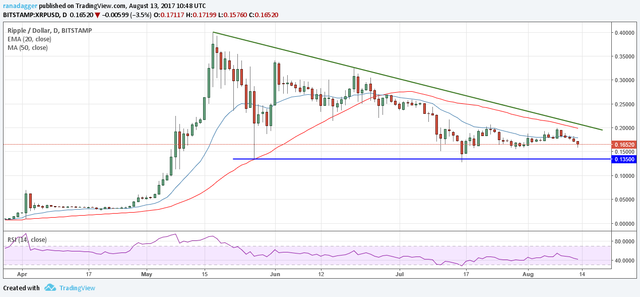
Nevertheless, as Ripple is quoting below both the critical moving averages that are trending down, traders should avoid taking fresh long positions until price breaks out of the downtrend line at $0.20000 and starts a new uptrend. Until then, it’s better to stick with the other currencies that are following a definite trend.
BCH/USD
After the initial few days of volatility, BCH/USD is currently settling down. As the currency has a short history, we shall use the 240-minute time frame on it.
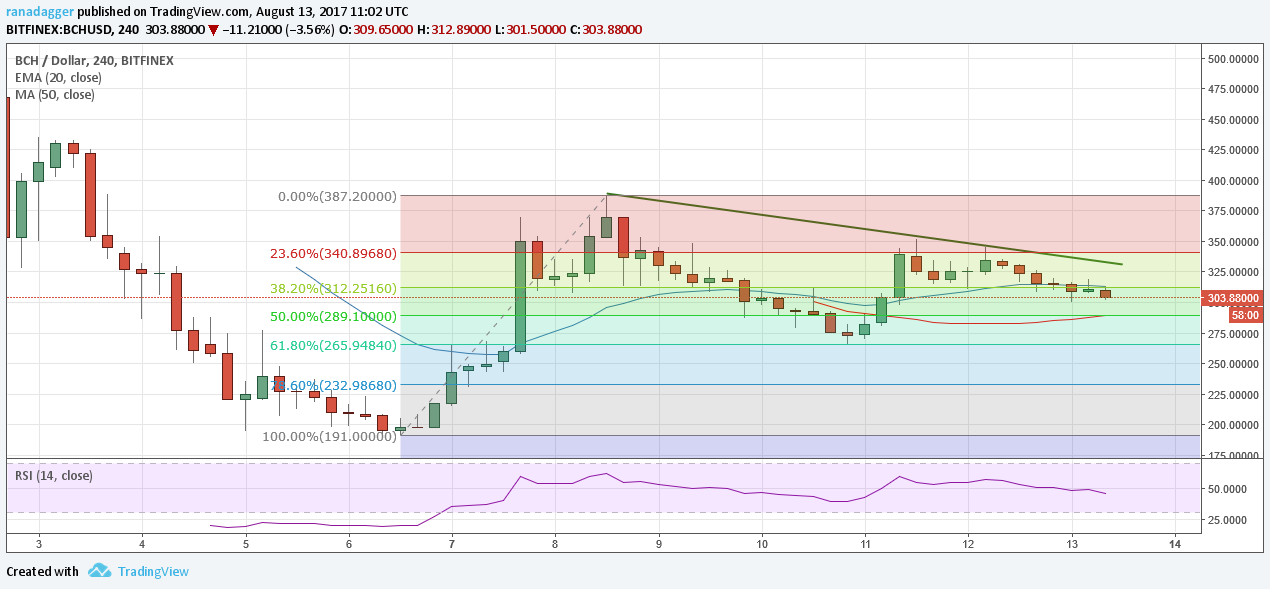
Presently, the price is moving lower towards the support levels of $280 and $265. The trend will change after the price breaks out of the downtrend line at about the $330 levels. Therefore, it is best to wait for lower levels to initiate fresh positions or wait for the breakout above the trendline.
Solid post. Nice to see I'm not the only one who thinks like this. The biggest group of uneducated investors in mankind get's a shot to determine the price of a crypto. It's an interesting world we live in. Personally I always use: https://www.coincheckup.com This site did all the research for you. It's truly amazing.