Bitcoin and Litecoin testing its life, what's next ? What do we have now ?--- let's review

Bitcoin: testing its life, what's next?
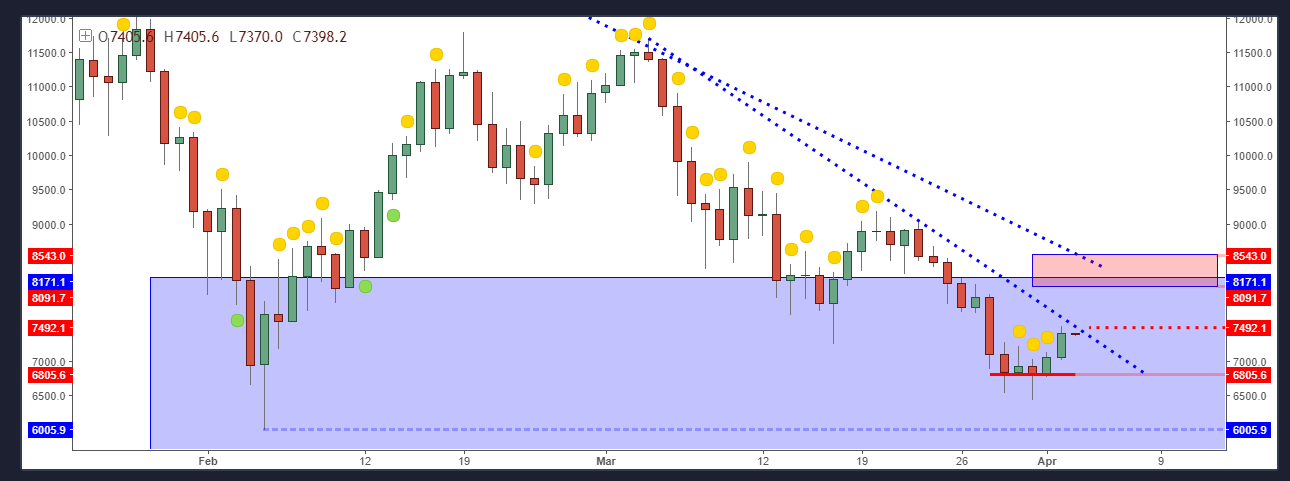
We can see that in the process of testing its own life, Bitcoin did not chose to do the proper bounce we were all expecting around this area, as it is kind of weak.
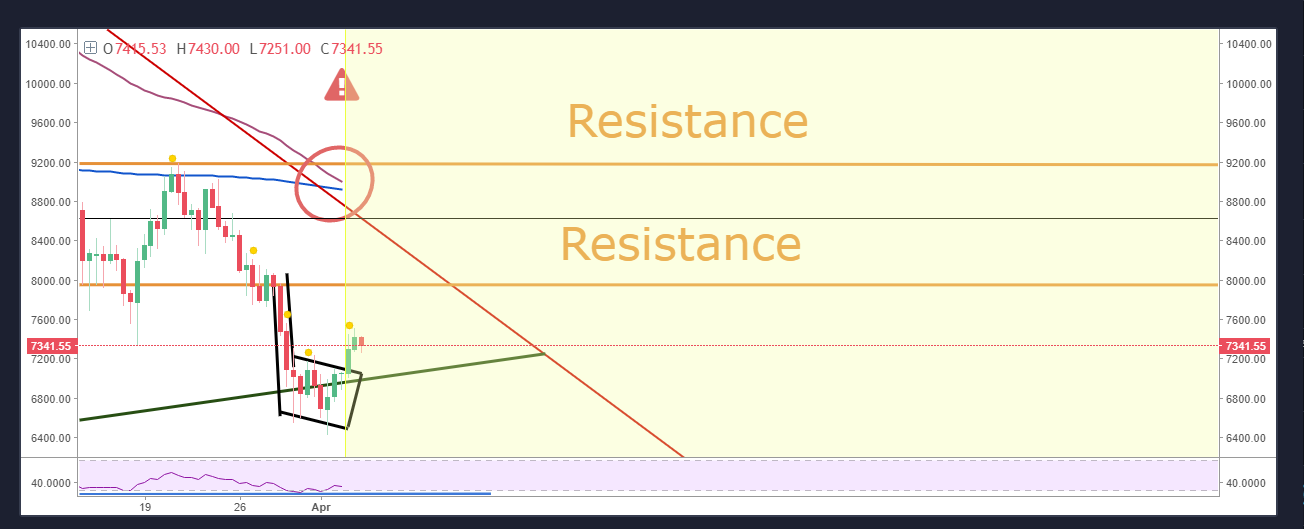
Instead, Btc decided... to form a bearish flag right in the middle of its line of life.
This is not a wise choise, as it means that Bitcoin has a bearish line of life. Feel free to decide what it actually means, i have absolutely no idea about this signification, but the chart does not lie, and the chart is saying that Bitcoin's life is bearish .
I was suspecting that when Btc did hit 6.450$ yesterday and started to bounce, it was actually producing the double bottom bounce from the February lows, but the bounce we are having is weak so i doubt.
We are having the 12h chart death cross almost done, which should not be the best possible help for Btc current situation.
What do we have now ? :
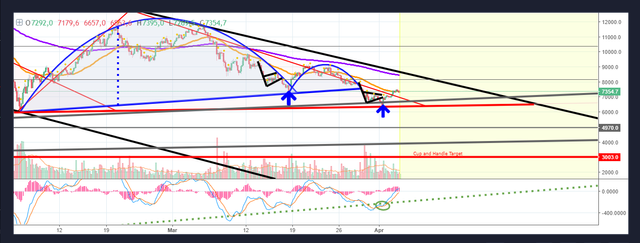
1°) Btc forms the double bottom we are all waiting for around the 6k zone, and we finally have a nice bounce to exploit. If we don't have a bounce here because of no double bottom formed, or if the bounce remains weak, we should expect 2°) to happen next
2°) Btc can fall from the bearish flag , and hit the purple double target zone.
This is the bear flag target + the fibo 0.786 level of the whole Bitcoin rallye start, this could be a strong support if this zone is reached. We can see that it used to be a resistance, and at many times a support in October and November, so it could be effective again.
3°) Btc finally bounces from where it is right now around the 6900$, which is of course a possibility, and finds resistance around 7.200$, 7.700$, 8150$.
The Rsi level is low, and we had some bullish signals earlier today and yesterday evening (European time), so bullishness is a possibility right now.
Btc generally bounces and raises when its Rsi level is around the 27. Watch for this level close to be reached on the 12h chart, it might produce bounces around this level, especially if Btc is close to some key levels.
Could be a buy signal, but use tight stop losses as the market is very weak still
And watch out, this might be a repetitive local pattern
Looking like more and more then bull trap bounce pattern from mid March, we Will soon have a confirmation if it is this pattern or not
Don't Let A Small Bounce Blind You! BITCOIN! (BTC)
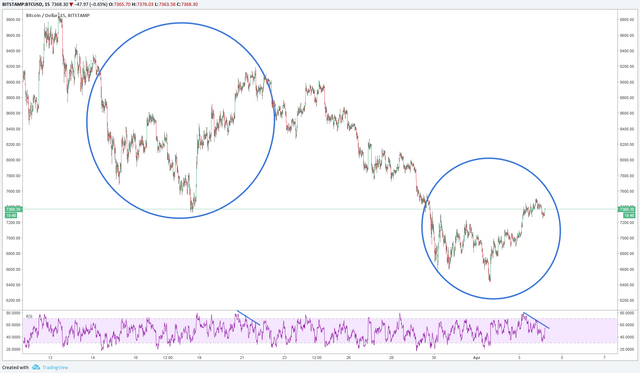
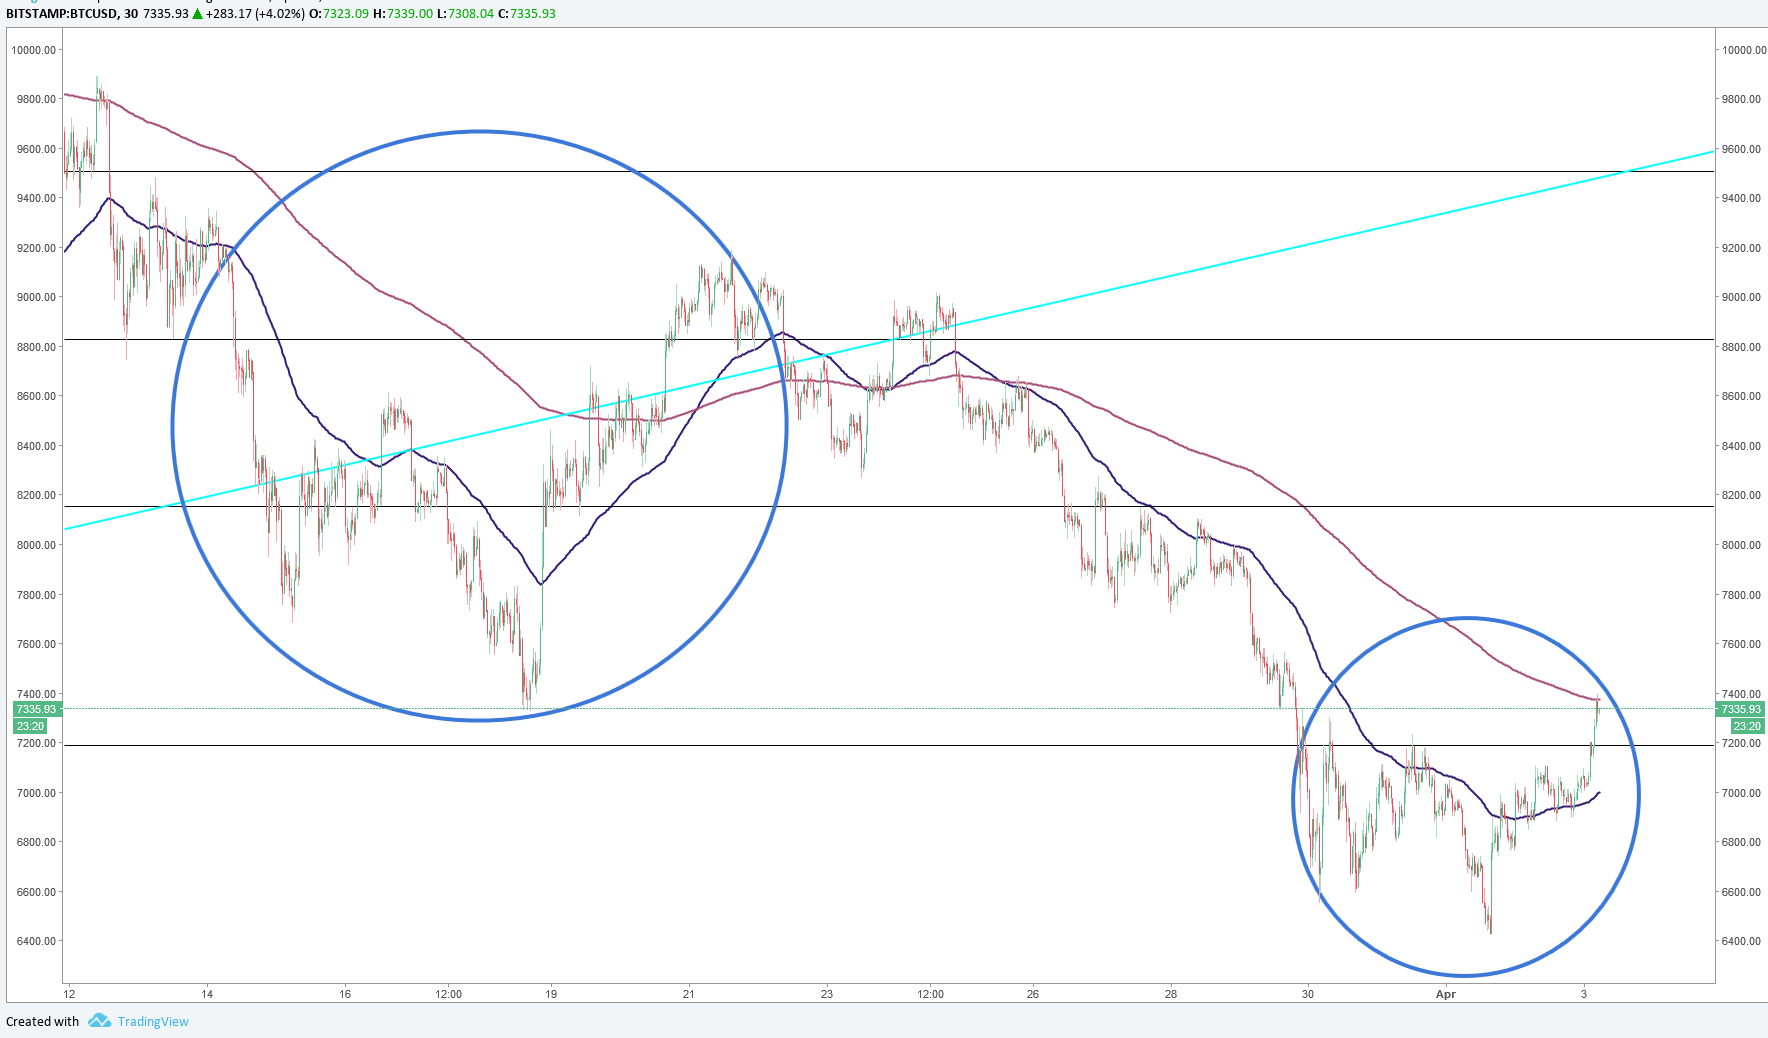
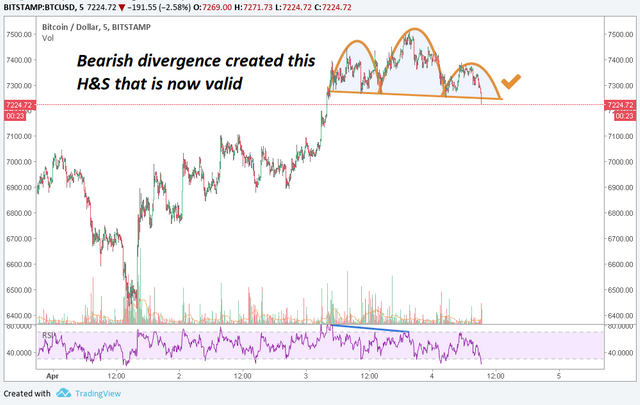
I want to draw your attention to the first blue arrow. If you look at the price action before that low was formed, you can see that there was a bear flag , that broke down to for the sharp low, and then price quickly rallied higher, forming somewhat of a small sloppy inverted head and shoulders pattern in the process. From there, it rallied just above the 50 EMA , where it ran out of gas, and inevitably rolled back over to the downside. Looking at the current action, it looks almost identical. You can see that we formed a bear flag , which broke down to produce a sharp low (blue arrow) and then we have quickly reversed back to the upside. Now, price has run into the 50 EMA , where it's beginning to find some resistance. So, just like the outcome of the rally off of the first blue arrow, I'm expecting a failure in this rally, in the very near future. In my opinion, this is a selling opportunity, and nothing more.
On the MACD , you can see that there was a bullish crossover, that produced some momentum expansion to the upside, but the volume has been on a steady decline during this entire rally off of the low. I still see broad weakness in BTC and the rest of the crypto space. A small bounce doesn't change that. Remember, the markets don't generally move in a straight line. Fluctuations can occur, but the important thing is that we remain on the right side of the market. Right now, this is an overwhelmingly strong bear market, that is experiencing a small bounce. The trend is your friend. Know that, own it, and you will avoid disaster. With that said, the overall trend is down, down, down, and it is highly likely to remain that way. I'm the master of the charts, the professor, the legend, the king, and I go by the name of Magic! Au revoir! ;)
To prove that the bears are losing control. price needs to: close above the bearish trend line and close above 7492 which is the .382 of the most recent bearish swing. IF the market can meet these requirements, that is still not enough for me to get long as a swing trade, or even add to my position trade. After the break, I want to see a subsequent higher low or failed low formation. Whether it is shallow or goes into extreme low territory near 6K, that is the move that I prefer to buy into at this point.
Waiting for the higher low scenario will not give you the best prices, BUT it will help filter out buying too early. Timing this is not perfect, and it would be preferable to see that higher low initiated by another pin bar . Ultimately how you enter and what kind of risk you are willing to take is up to you. If you have no problem holding this market to zero, then buying anywhere near these lows is not a bad idea.
What about shorting? From a technical standpoint if I was able to short these markets, I would consider such a level for day trading purposes only. I must reiterate, holding longer time frame shorts at these levels is extremely risky, especially when some exchanges will not let you out of your position because of a liquidity shortage during a squeeze. Shorting on a day trade basis requires a ton of attention, and a very fast decision making process in order to decisively get out if you are wrong. Not a good idea for less experienced traders.
In summary, do not get sucked into the impulsiveness of these markets. From low to high, this market moved 1k points. People who do not know how to put this into perspective will look across all of the coins, see a lot of green, and proclaim, "The bottom is in!". In terms of structure, there is no evidence that suggests that the bearish momentum is losing its grip. According to the current structure in place, it is still within reason to expect a lower low or at least a retest of the low. The key to taking action is when the market does NOT do what it is setting up to do. It is setting up to establish a lower high which often leads to a lower low. If it can't make that lower low upon a retest, that is the evidence that reveals the bears are exhausted. Being that this market is in the middle of a major support zone , a failed low is a very welcome sign at such a location. I laid out the scenarios, now you must figure out your decisions in advance so that you are not reacting, you are instead following your plan.
This information is not a recommendation to buy or sell. It is to be used for educational purposes only.
LTC and BTC Move in Bull Trapping Tandem! LITECOIN!
Welcome to this update analysis on Litecoin! Let's get right to it! Looking at the four hour chart, you can see that LTC has rallied hard over the past couple days, as it seems to be reacting from a low that was made just barely above the 2/6 double bottom . LTC was close to breaking down, but it seems as though the market wants to trap some more bulls before the breakdown. Looking at this rally, I have absolutely no interest in buying it. Instead, I'm just viewing it as a great sell opportunity.
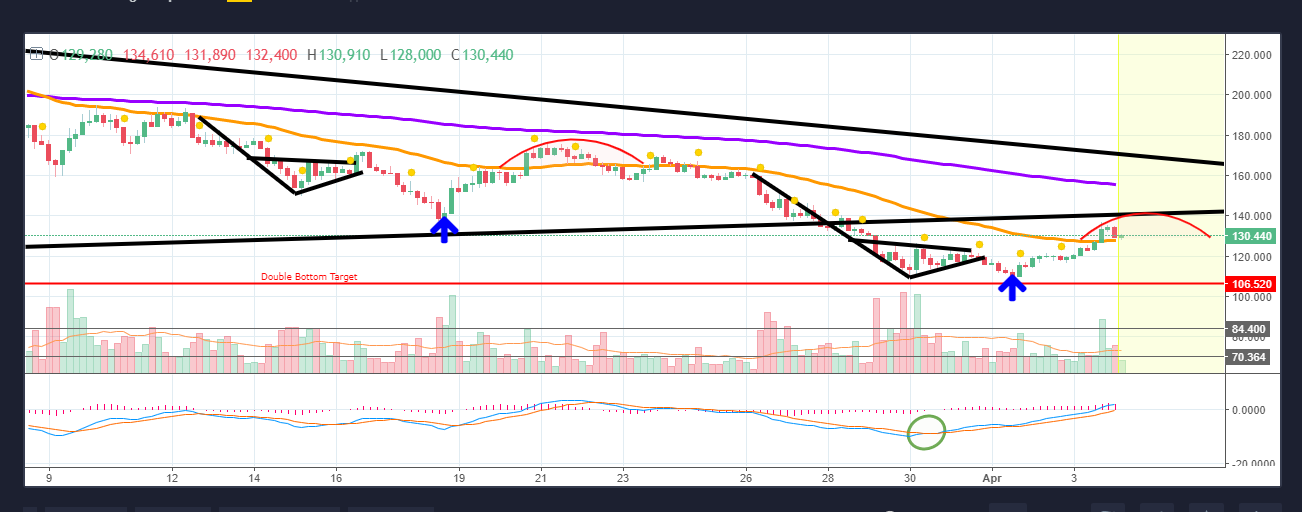
If you recall from my last post, I was covering the bear flag that LTC was creating. As you can see, a breakdown from the bear flag did occur, but price rallied hard after the bear flag breakdown, as a wave of buyers rushed into the market, probably trying to catch the double bottom , and also because LTC was oversold. However, I wouldn't get too excited about the rally. In my view, it's just another pop before the big drop. Looking at the chart, you can see that LTC is right above the 50 EMA (in orange.) Now, I'm not just saying that I don't buy this rally for nothing. Here is the technical reason why I think it won't last.
I want to draw your attention to the first blue arrow. If you look at the price action before that low was formed, you can see that there was a bear flag , that broke down to for the sharp low, and then price quickly rallied higher, forming somewhat of a small sloppy inverted head and shoulders pattern in the process. From there, it rallied just above the 50 EMA , where it ran out of gas, and inevitably rolled back over to the downside. Looking at the current action, it looks almost identical. You can see that we formed a bear flag , which broke down to produce a sharp low (blue arrow) and then we have quickly reversed back to the upside, forming a sloppy inverse head and shoulders . Now, price has run just above the 50 EMA , where it could be running out of steam. So, just like the outcome of the rally off of the first blue arrow, I'm expecting a failure in this rally, in the very near future. In my opinion, this is a selling opportunity, and nothing more.
I still see broad weakness in LTC and the rest of the crypto space. A small bounce doesn't change that. Remember, the markets don't generally move in a straight line. Fluctuations can occur, but the important thing is that we remain on the right side of the market. Right now, this is an overwhelmingly strong bear market, which is experiencing a small bounce. The trend is your friend! Know that, own it, and you will avoid disaster. With that said, the overall trend is down, down, down, and it is highly likely to remain that way.
This information is not a recommendation to buy or sell. It is to be used for educational purposes only.
If you are not already on the stock exchange, you can register
#litecoin #ethereum #steemit #analys #analyisis #cryptocurrency #crypto #ltc #btc #trx #tron #bitcoin #arch #blockchain
Sourece by @a-blockchain
Source
Questions and comments welcome.
Your Post Has Been Featured on @Resteemable!
Feature any Steemit post using resteemit.com!
How It Works:
1. Take Any Steemit URL
2. Erase
https://3. Type
reGet Featured Instantly & Featured Posts are voted every 2.4hrs
Join the Curation Team Here | Vote Resteemable for Witness