Elliotts Wave Excel Model - Will STEEM drop to $0.81?
After a recent conversation about fractals and Cryptocurrency with @RT395 I decided to do a little research into the topic. Trading theory is all new to me, but I came across a very well know trading pattern based on fractals known as Elliott’s Wave theory.
Being the spreadsheet person I am, I decided to create a model that will allow me calculate the basic wave theory in excel for any crypto currency over any duration starting at any date or time of day I specify.
Lol the model is proving more difficult than I originally planned. But I am well on my way and while testing the model I have uncovered a few Elliott wave patterns in STEEM prices that you just might be interested in.
The Excel Model
But before I share the interesting charts, I really want to share with you my progress I am making on the model.
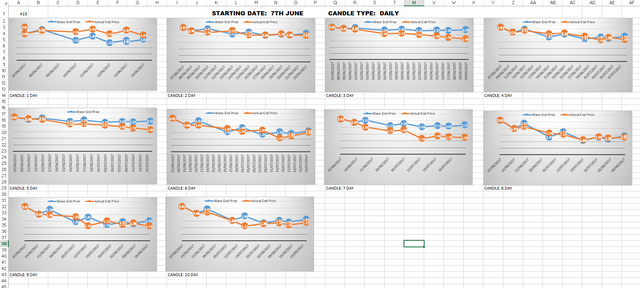
The sample shown is a daily chart. Chart 1 first wave is one day, chart 2 the first wave is 2 days long, chart 3 the first wave is 3 days long and so forth.
The model will be driven by date, which I can change very quickly on this page. From the date I carry out the following calculations to find the plot points for Elliott wave (the waves are the blue lines in the charts above)
Wave1StartPoint = Lowprice *start date
Wave1EndPoint = HighPrice
Wave2StartPoint = Wave1EndPoint
Wave2EndPoint = Wave2StartPoint - ((HighPrice - LowPrice) * 0.618)
Wave3StartPoint = Wave2EndPoint
Wave3EndPoint = Wave2StartPoint + ((HighPrice - LowPrice) * 1.618)
Wave4StartPoint = Wave3EndPoint
Wave4EndPoint = Wave2StartPoint - ((Wave3EndPoint - Wave3StartPoint) * 0.382)
Wave5StartPoint = Wave4EndPoint
Wave5EndPoint = Wave2StartPoint + (HighPrice - LowPrice)
WaveAStartPoint = Wave5EndPoint
WaveAEndPoint = WaveAStartPoint - ((Wave5EndPoint + Wave5StartPoint) * 0.382)
WaveBStartPoint = WaveAEndPoint
WaveBEndPoint = WaveAStartPoint + (HighPrice - LowPrice) * 0.618)
WaveCStartPoint = WaveBEndPoint
WaveCEndPoint = WaveCStartPoint - (HighPrice - LowPrice)
Once I have calculated my wave lengths and durations, I then carry out a lookup against data downloaded from coinmarketcap.com for the relevant dates and take the closing price of STEEM as of that data.
This gives me the actual prices of STEEM to plot against the projected wave. These values can been seen in orange on the charts above.
To complete this model there is still some work to do. I need to add in some sort of variance between wave prediction and actual and find a margin of error that I would be comfortable with. I also need to increase the number of charts. At the moment there are only 10 charts. I need to get this up to about 30.
Finally I need to be able to change between different time frames, such as hourly or 5 mins.
Elliott Wave and STEEM
While testing the model, I found a few interesting charts.
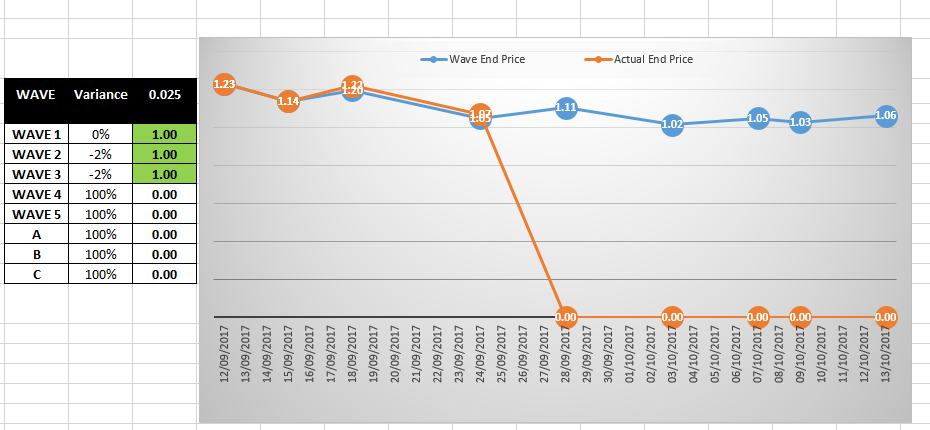
This first chart has a start date of 12 Sept, STEEM price of $1.23. The first wave is 4 days ending on the 15th Sept. Waves 1-3 are all within a 2.5% variance. That means the close price for STEEM as per this prediction on the 28th Sept will be $1.11 and on the 3rd of October the 5 wave will end on a price of $1.02. (Need to also fix these chart so when the price of STEEM is not available the chart stops instead of dropping to 0)
This next wave prediction is a little more risky as there is a variance of 5% in wave 2 and 11% in wave 3. This wave starts on 28 Aug and wave 1 is 8 days long. Will the price of STEEM be $1.07 on the 2nd Oct and $0.81 on the 9th Oct?
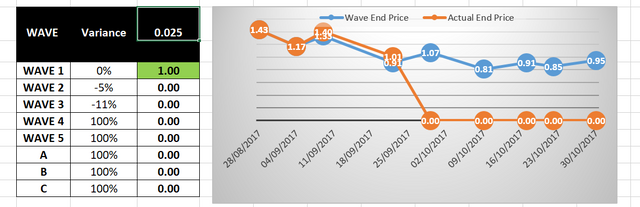
All we can do is wait and see?
Please do not take any of this as trading advice. I am not trading on these charts as I am still working out the model and through the theory. I am also not a financial adviser and have no experience in trading crypto currencies.
I am part of a Steemit Business Intelligence community. We all post under the tag #BIsteemit. If you have an analysis you would like carried out on Steemit data, please do contact me or any of the #bisteemit team and we will do our best to help you...
Congratulations! This post has been upvoted from the communal account, @minnowsupport, by paulag from the Minnow Support Project. It's a witness project run by aggroed, ausbitbank, teamsteem, theprophet0, someguy123, neoxian, followbtcnews/crimsonclad, and netuoso. The goal is to help Steemit grow by supporting Minnows and creating a social network. Please find us in the Peace, Abundance, and Liberty Network (PALnet) Discord Channel. It's a completely public and open space to all members of the Steemit community who voluntarily choose to be there.
Hello Our Bisteemit Lady (-: So now does the model say it's going back to $0.81 (-: Have to add in the Smart Media Token factor!
lol, it be interesting to see the next forecasts
I recall you had some steem price prediction earlier. it'll be interesting to revisit your previous prediction when the time comes.
I will update on that post this week @eduter. i though my prediction was to month end....seems it was to mid month so I am late with the update
We were talking about fractals, but I think the reason I brought them up was because there was a guest on the Sam Harris podcast, a professor from New Mexico labs who spoke about patterns everywhere, in nature, humanity, societies, etc. Some of those patterns crossed species and organizations. Almost as if it's beyond our control and a natural occurrence. Which lead me to fractals in nature and then to thinking do those same patterns, not necessarily fractals, occur within the stock market and/or new technologies.
Looking forward to digging deeper into what you wrote this weekend. Not looking forward to Steem going to $0.82!
this process is very interesting, but it would have to see if the theory agrees with the practice, since there are several external factors that will affect the price of Steem, thank you very much for sharing
would you speak english please (-: so do they use this for stock markets? or are you applying a new theory with this elliot stuff
its used for the stockmarkets
still a good buy